Reebok 2012 Annual Report Download - page 270
Download and view the complete annual report
Please find page 270 of the 2012 Reebok annual report below. You can navigate through the pages in the report by either clicking on the pages listed below, or by using the keyword search tool below to find specific information within the annual report.-
 1
1 -
2
-
3
-
4
-
5
-
6
-
7
-
8
-
9
-
10
-
11
-
12
-
13
-
14
-
15
-
16
-
17
-
18
-
19
-
20
-
21
-
22
-
23
-
24
-
25
-
26
-
27
-
28
-
29
-
30
-
31
-
32
-
33
-
34
-
35
-
36
-
37
-
38
-
39
-
40
-
41
-
42
-
43
-
44
-
45
-
46
-
47
-
48
-
49
-
50
-
51
-
52
-
53
-
54
-
55
-
56
-
57
-
58
-
59
-
60
-
61
-
62
-
63
-
64
-
65
-
66
-
67
-
68
-
69
-
70
-
71
-
72
-
73
-
74
-
75
-
76
-
77
-
78
-
79
-
80
-
81
-
82
-
83
-
84
-
85
-
86
-
87
-
88
-
89
-
90
-
91
-
92
-
93
-
94
-
95
-
96
-
97
-
98
-
99
-
100
-
101
-
102
-
103
-
104
-
105
-
106
-
107
-
108
-
109
-
110
-
111
-
112
-
113
-
114
-
115
-
116
-
117
-
118
-
119
-
120
-
121
-
122
-
123
-
124
-
125
-
126
-
127
-
128
-
129
-
130
-
131
-
132
-
133
-
134
-
135
-
136
-
137
-
138
-
139
-
140
-
141
-
142
-
143
-
144
-
145
-
146
-
147
-
148
-
149
-
150
-
151
-
152
-
153
-
154
-
155
-
156
-
157
-
158
-
159
-
160
-
161
-
162
-
163
-
164
-
165
-
166
-
167
-
168
-
169
-
170
-
171
-
172
-
173
-
174
-
175
-
176
-
177
-
178
-
179
-
180
-
181
-
182
-
183
-
184
-
185
-
186
-
187
-
188
-
189
-
190
-
191
-
192
-
193
-
194
-
195
-
196
-
197
-
198
-
199
-
200
-
201
-
202
-
203
-
204
-
205
-
206
-
207
-
208
-
209
-
210
-
211
-
212
-
213
-
214
-
215
-
216
-
217
-
218
-
219
-
220
-
221
-
222
-
223
-
224
-
225
-
226
-
227
-
228
-
229
-
230
-
231
-
232
-
233
-
234
-
235
-
236
-
237
-
238
-
239
-
240
-
241
-
242
-
243
-
244
-
245
-
246
-
247
-
248
-
249
-
250
-
251
-
252
-
253
-
254
-
255
-
256
-
257
-
258
-
259
-
 260
260 -
 261
261 -
 262
262 -
 263
263 -
 264
264 -
 265
265 -
 266
266 -
 267
267 -
 268
268 -
 269
269 -
 270
270 -
 271
271 -
 272
272 -
 273
273 -
 274
274 -
 275
275 -
 276
276 -
 277
277 -
 278
278 -
 279
279 -
 280
280 -
281
-
282
 |
 |
adidas Group
/
2012 Annual Report
Additional Information
248
2012
/
05.1
/
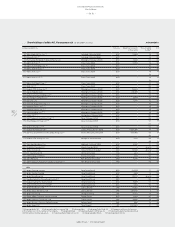
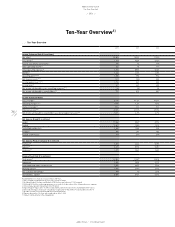
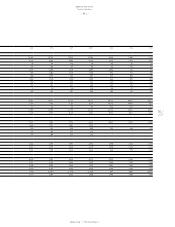
Ten-Year Overview
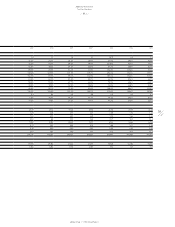
Rounding differences may arise in percentages and totals.
1) 2011 restated according to IAS 8. Prior years are not restated.
2) Including Reebok, Rockport and Reebok-CCM Hockey from February 1, 2006 onwards.
3) 2004 and 2005 reflect continuing operations as a result of the divestiture of the Salomon business segment.
4) 2012 excludes goodwill impairment of € 265 million.
5) Operating profit figures prior to 2004 exclude royalty and commission income and goodwill amortisation.
6) 2003 and 2004 figures have been restated due to application of IAS 32/IAS 39 and amendment to IAS 19.
7) Includes income from continuing and discontinued operations.
8) Figures adjusted for 1:4 share split conducted on June 6, 2006.
9) Subject to Annual General Meeting approval.
..
/
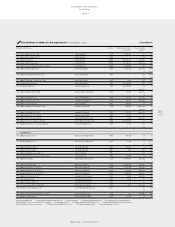
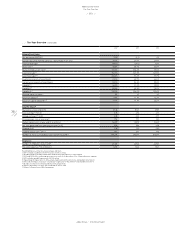
Ten-Year Overview (continued)
2012 2011 2010
Balance Sheet Ratios
Net borrowings/EBITDA 3) (0.3) (0.1) 0.2
Average operating working capital as a percentage of net sales 20.0% 20.4% 20.8%
Financial leverage 6) (8.5%) (1.8%) 4.8%
Equity ratio 6) 45.5% 45.7% 43.5%
Equity-to-fixed-assets ratio 6) 111.1% 104.6% 97.4%
Asset Coverage 6) 152.7% 140.7% 141.5%
Asset Coverage II 6) 100.4% 93.2% 97.7%
Fixed asset intensity of investments 41.0% 43.7% 44.6%
Current asset intensity of investments 59.0% 56.3% 55.4%
Liquidity I 6) 44.3% 31.6% 35.5%
Liquidity II 6) 82.9% 68.3% 78.2%
Liquidity III 6) 139.7% 126.0% 132.4%
Working capital turnover 6) 5.9 6.7 6.1
Return on equity 6) 7) 9.9% 11.9% 12.3%
Return on capital employed 6) 7) 19.3% 19.9% 20.2%
Data Per Share 8)
Share price at year-end (in €) 67.33 50.26 48.89
Basic earnings 4) 7) (in €) 3.78 2.93 2.71
Diluted earnings 4) 7) (in €) 3.78 2.93 2.71
Price/earnings ratio at year-end 4) 17.8 17.1 18.0
Market capitalisation at year-end (€ in millions) 14,087 10,515 10,229
Net cash generated from operating activities (in €) 4.50 3.86 4.28
Dividend (in €) 1.35 9) 1.00 0.80
Dividend payout ratio 4) (in %) 35.7 34.1 29.5
Number of shares outstanding at year-end (in thousands) 209,216 209,216 209,216
Employees
Number of employees at year-end 3) 46,306 46,824 42,541
Personnel expenses 3) (€ in millions) 1,872 1,646 1,521