Reebok 2012 Annual Report Download - page 252
Download and view the complete annual report
Please find page 252 of the 2012 Reebok annual report below. You can navigate through the pages in the report by either clicking on the pages listed below, or by using the keyword search tool below to find specific information within the annual report.-
 1
1 -
2
-
3
-
4
-
5
-
6
-
7
-
8
-
9
-
10
-
11
-
12
-
13
-
14
-
15
-
16
-
17
-
18
-
19
-
20
-
21
-
22
-
23
-
24
-
25
-
26
-
27
-
28
-
29
-
30
-
31
-
32
-
33
-
34
-
35
-
36
-
37
-
38
-
39
-
40
-
41
-
42
-
43
-
44
-
45
-
46
-
47
-
48
-
49
-
50
-
51
-
52
-
53
-
54
-
55
-
56
-
57
-
58
-
59
-
60
-
61
-
62
-
63
-
64
-
65
-
66
-
67
-
68
-
69
-
70
-
71
-
72
-
73
-
74
-
75
-
76
-
77
-
78
-
79
-
80
-
81
-
82
-
83
-
84
-
85
-
86
-
87
-
88
-
89
-
90
-
91
-
92
-
93
-
94
-
95
-
96
-
97
-
98
-
99
-
100
-
101
-
102
-
103
-
104
-
105
-
106
-
107
-
108
-
109
-
110
-
111
-
112
-
113
-
114
-
115
-
116
-
117
-
118
-
119
-
120
-
121
-
122
-
123
-
124
-
125
-
126
-
127
-
128
-
129
-
130
-
131
-
132
-
133
-
134
-
135
-
136
-
137
-
138
-
139
-
140
-
141
-
142
-
143
-
144
-
145
-
146
-
147
-
148
-
149
-
150
-
151
-
152
-
153
-
154
-
155
-
156
-
157
-
158
-
159
-
160
-
161
-
162
-
163
-
164
-
165
-
166
-
167
-
168
-
169
-
170
-
171
-
172
-
173
-
174
-
175
-
176
-
177
-
178
-
179
-
180
-
181
-
182
-
183
-
184
-
185
-
186
-
187
-
188
-
189
-
190
-
191
-
192
-
193
-
194
-
195
-
196
-
197
-
198
-
199
-
200
-
201
-
202
-
203
-
204
-
205
-
206
-
207
-
208
-
209
-
210
-
211
-
212
-
213
-
214
-
215
-
216
-
217
-
218
-
219
-
220
-
221
-
222
-
223
-
224
-
225
-
226
-
227
-
228
-
229
-
230
-
231
-
232
-
233
-
234
-
235
-
236
-
237
-
238
-
239
-
240
-
241
-
 242
242 -
 243
243 -
 244
244 -
 245
245 -
 246
246 -
 247
247 -
 248
248 -
 249
249 -
 250
250 -
 251
251 -
 252
252 -
 253
253 -
 254
254 -
 255
255 -
 256
256 -
 257
257 -
 258
258 -
 259
259 -
 260
260 -
 261
261 -
 262
262 -
263
-
264
-
265
-
266
-
267
-
268
-
269
-
270
-
271
-
272
-
273
-
274
-
275
-
276
-
277
-
278
-
279
-
280
-
281
-
282
 |
 |

adidas Group
/
2012 Annual Report
Consolidated Financial Statements
230
2012
/
04.8
/
Notes
/
Notes to the Consolidated Income Statement
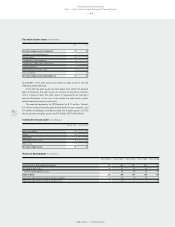
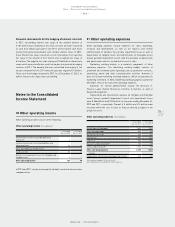
32 Cost by nature
Expenses are presented by function according to the “cost of sales
method” in the income statement. Supplementary information on the
expenses by nature is detailed below.
Cost of materials
The total cost of materials relating to the amount of inventories
recognised as an expense during the period was € 7.641 billion and
€ 6.876 billion (restated) for the years ending December 31, 2012 and
2011, respectively.
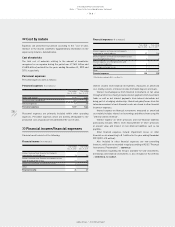
Personnel expenses
Personnel expenses were as follows:
Personnel expenses (€ in millions)
Year ending
Dec. 31, 2012
Year ending
Dec. 31, 2011
Wages and salaries 1,634 1,439
Social security contributions 169 152
Pension expenses 69 55
Personnel expenses 1,872 1,646
Personnel expenses are primarily included within other operating
expenses. Personnel expenses which are directly attributable to the
production costs of goods are included within the cost of sales.
33 Financial income/financial expenses
Financial result consists of the following:
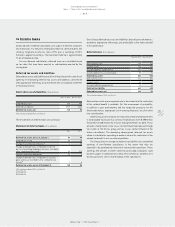
Financial income (€ in millions)
Year ending
Dec. 31, 2012
Year ending
Dec. 31, 2011
Interest income from financial instruments
measured at amortised cost 13 12
Interest income from financial instruments at fair
value through profit or loss 22 18
Interest income from non-financial assets 0 0
Other 1 1
Financial income 36 31
Financial expenses (€ in millions)
Year ending
Dec. 31, 2012
Year ending
Dec. 31, 2011 1)
Interest expense on financial instruments
measured at amortised cost 97 108
Interest expense on financial instruments at fair
value through profit or loss 0 0
Interest expense on other provisions and
non-financial liabilities 0 0
Net foreign exchange losses 7 7
Other 1 0
Financial expenses 105 115
1) Restated according to IAS 8, see Note 03.
Interest income from financial instruments, measured at amortised
cost, mainly consists of interest income from bank deposits and loans.
Interest income/expense from financial instruments at fair value
through profit or loss mainly includes interest payments from investment
funds as well as net interest payments from interest derivatives not
being part of a hedging relationship. Unrealised gains/losses from fair
value measurement of such financial assets are shown in other financial
income or expenses.
Interest expense on financial instruments measured at amortised
cost mainly includes interest on borrowings and effects from using the
“effective interest method”.
Interest expense on other provisions and non-financial liabilities
particularly includes effects from measurement of other provisions
at present value and interest on non-financial liabilities such as tax
payables.
Other financial expenses include impairment losses on other
financial assets amounting to € 1 million for the year ending December
2012 (2011: € 0 million).
Also included in other financial expenses are non-controlling
interests, which are not recorded in equity according to IAS 32 “Financial
Instruments: Presentation”
/
SEE NOTE 27.
Information regarding the Group’s available-for-sale investments,
borrowings and financial instruments is also included in these Notes
/
SEE NOTES 06, 15, 18 AND 29.