Reebok 2012 Annual Report Download - page 155
Download and view the complete annual report
Please find page 155 of the 2012 Reebok annual report below. You can navigate through the pages in the report by either clicking on the pages listed below, or by using the keyword search tool below to find specific information within the annual report.-
 1
1 -
2
-
3
-
4
-
5
-
6
-
7
-
8
-
9
-
10
-
11
-
12
-
13
-
14
-
15
-
16
-
17
-
18
-
19
-
20
-
21
-
22
-
23
-
24
-
25
-
26
-
27
-
28
-
29
-
30
-
31
-
32
-
33
-
34
-
35
-
36
-
37
-
38
-
39
-
40
-
41
-
42
-
43
-
44
-
45
-
46
-
47
-
48
-
49
-
50
-
51
-
52
-
53
-
54
-
55
-
56
-
57
-
58
-
59
-
60
-
61
-
62
-
63
-
64
-
65
-
66
-
67
-
68
-
69
-
70
-
71
-
72
-
73
-
74
-
75
-
76
-
77
-
78
-
79
-
80
-
81
-
82
-
83
-
84
-
85
-
86
-
87
-
88
-
89
-
90
-
91
-
92
-
93
-
94
-
95
-
96
-
97
-
98
-
99
-
100
-
101
-
102
-
103
-
104
-
105
-
106
-
107
-
108
-
109
-
110
-
111
-
112
-
113
-
114
-
115
-
116
-
117
-
118
-
119
-
120
-
121
-
122
-
123
-
124
-
125
-
126
-
127
-
128
-
129
-
130
-
131
-
132
-
133
-
134
-
135
-
136
-
137
-
138
-
139
-
140
-
141
-
142
-
143
-
144
-
 145
145 -
 146
146 -
 147
147 -
 148
148 -
 149
149 -
 150
150 -
 151
151 -
 152
152 -
 153
153 -
 154
154 -
 155
155 -
 156
156 -
 157
157 -
 158
158 -
 159
159 -
 160
160 -
 161
161 -
 162
162 -
 163
163 -
 164
164 -
 165
165 -
166
-
167
-
168
-
169
-
170
-
171
-
172
-
173
-
174
-
175
-
176
-
177
-
178
-
179
-
180
-
181
-
182
-
183
-
184
-
185
-
186
-
187
-
188
-
189
-
190
-
191
-
192
-
193
-
194
-
195
-
196
-
197
-
198
-
199
-
200
-
201
-
202
-
203
-
204
-
205
-
206
-
207
-
208
-
209
-
210
-
211
-
212
-
213
-
214
-
215
-
216
-
217
-
218
-
219
-
220
-
221
-
222
-
223
-
224
-
225
-
226
-
227
-
228
-
229
-
230
-
231
-
232
-
233
-
234
-
235
-
236
-
237
-
238
-
239
-
240
-
241
-
242
-
243
-
244
-
245
-
246
-
247
-
248
-
249
-
250
-
251
-
252
-
253
-
254
-
255
-
256
-
257
-
258
-
259
-
260
-
261
-
262
-
263
-
264
-
265
-
266
-
267
-
268
-
269
-
270
-
271
-
272
-
273
-
274
-
275
-
276
-
277
-
278
-
279
-
280
-
281
-
282
 |
 |
adidas Group
/
2012 Annual Report
Group Management Report – Financial Review
133
2012
/
03.2
/
Group Business Performance
/
Income Statement
47.5%
/
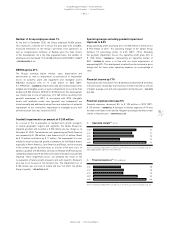
DIAGRAM 15. The positive impact from product price increases,
a more favourable product and regional sales mix as well as a larger
share of higher-margin Retail sales more than offset the increase
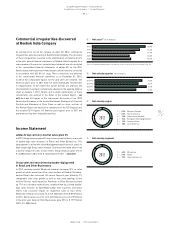
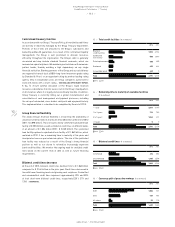
in input costs. Gross profit for the adidas Group grew 12% in 2012 to
€ 7.103 billion versus € 6.329 billion in the prior year
/
DIAGRAM 14.
Royalty and commission income grows
Royalty and commission income for the adidas Group increased 13% to
€ 105 million in 2012 from € 93 million in the prior year. On a currency-
neutral basis, royalty and commission income was up 11%, mainly as a
result of higher licensee sales at adidas.
Other operating income increases
Other operating income includes items such as gains from the disposal
of fixed assets and releases of accruals and provisions as well as
insurance compensation. In 2012, other operating income increased
29% to € 127 million (2011: € 98 million). This was mainly due to an
increase in income from insurance compensation as well as the release
of operational accruals and provisions
/
SEE NOTE 30, P. 229.
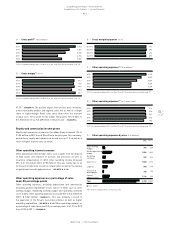
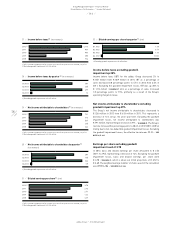
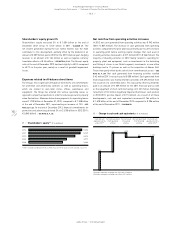
Other operating expenses as a percentage of sales
down 0.5 percentage points
Other operating expenses, including depreciation and amortisation
excluding goodwill impairment losses, consist of items such as sales
working budget, marketing working budget and operating overhead
costs. In 2012, other operating expenses increased 10% to € 6.150 billion
(2011: € 5.567 billion)
/
DIAGRAM 17. This was primarily a result of
the expansion of the Group’s own-retail activities as well as higher
marketing expenditure
/
SEE NOTE 31, P. 229. Other operating expenses as
a percentage of sales decreased 0.5 percentage points to 41.3% in 2012
from 41.8% in 2011
/
DIAGRAM 18.
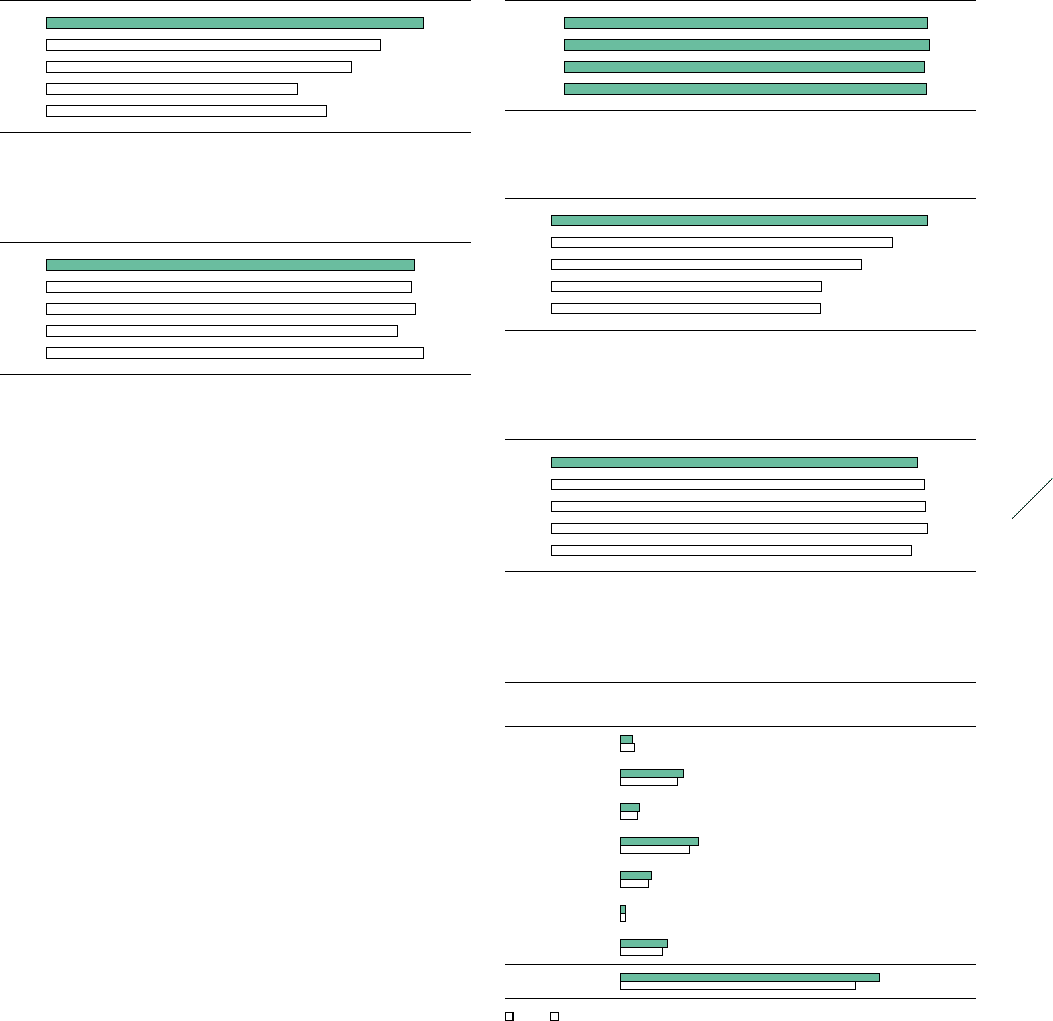
14
/
Gross profit 1) (€ in millions)
2012 7,103
2011 6,329
2010 5,730
2009 4,712
2008 5,256
1) 2011 restated according to IAS 8, see Note 03, p. 203. Prior years are not restated, see p. 131.
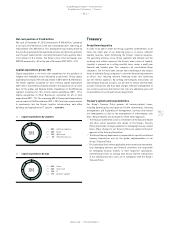
15
/
Gross margin 1) (in %)
2012 47.7
2011 47.5
2010 47.8
2009 45.4
2008 48.7
1) 2011 restated according to IAS 8, see Note 03, p. 203. Prior years are not restated, see p. 131.
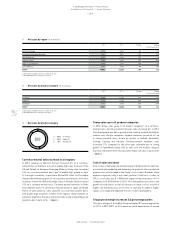
17
/
Other operating expenses 1) (€ in millions)
2012 6,150
2011 5,567
2010 5,046
2009 4,390
2008 4,378
1) 2011 restated according to IAS 8, see Note 03, p. 203. Prior years are not restated, see p. 131.
18
/
Other operating expenses 1) (in % of net sales)
2012 41.3
2011 41.8
2010 42.1
2009 42.3
2008 40.5
1) 2011 restated according to IAS 8, see Note 03, p. 203. Prior years are not restated, see p. 131.
16
/
Gross margin by quarter (in %)
Q1 2012 47.7
Q2 2012 48.2
Q3 2012 47.4
Q4 2012 47.6
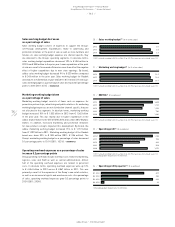
19
/
Other operating expenses by area (€ in millions)
2012 2011 1)
Sales working
budget 304 338
Marketing working
budget 1,502 1,362
Marketing
overhead 445 402
Sales force 1,885 1,673
Logistics 750 678
Research &
development 128 115
Central
administration 1,136 999
Total 6,150 5,567
■ 2012 ■ 2011
1) Restated according to IAS 8, see Note 03, p. 203.