Reebok 2012 Annual Report Download - page 162
Download and view the complete annual report
Please find page 162 of the 2012 Reebok annual report below. You can navigate through the pages in the report by either clicking on the pages listed below, or by using the keyword search tool below to find specific information within the annual report.-
 1
1 -
2
-
3
-
4
-
5
-
6
-
7
-
8
-
9
-
10
-
11
-
12
-
13
-
14
-
15
-
16
-
17
-
18
-
19
-
20
-
21
-
22
-
23
-
24
-
25
-
26
-
27
-
28
-
29
-
30
-
31
-
32
-
33
-
34
-
35
-
36
-
37
-
38
-
39
-
40
-
41
-
42
-
43
-
44
-
45
-
46
-
47
-
48
-
49
-
50
-
51
-
52
-
53
-
54
-
55
-
56
-
57
-
58
-
59
-
60
-
61
-
62
-
63
-
64
-
65
-
66
-
67
-
68
-
69
-
70
-
71
-
72
-
73
-
74
-
75
-
76
-
77
-
78
-
79
-
80
-
81
-
82
-
83
-
84
-
85
-
86
-
87
-
88
-
89
-
90
-
91
-
92
-
93
-
94
-
95
-
96
-
97
-
98
-
99
-
100
-
101
-
102
-
103
-
104
-
105
-
106
-
107
-
108
-
109
-
110
-
111
-
112
-
113
-
114
-
115
-
116
-
117
-
118
-
119
-
120
-
121
-
122
-
123
-
124
-
125
-
126
-
127
-
128
-
129
-
130
-
131
-
132
-
133
-
134
-
135
-
136
-
137
-
138
-
139
-
140
-
141
-
142
-
143
-
144
-
145
-
146
-
147
-
148
-
149
-
150
-
151
-
 152
152 -
 153
153 -
 154
154 -
 155
155 -
 156
156 -
 157
157 -
 158
158 -
 159
159 -
 160
160 -
 161
161 -
 162
162 -
 163
163 -
 164
164 -
 165
165 -
 166
166 -
 167
167 -
 168
168 -
 169
169 -
 170
170 -
 171
171 -
 172
172 -
173
-
174
-
175
-
176
-
177
-
178
-
179
-
180
-
181
-
182
-
183
-
184
-
185
-
186
-
187
-
188
-
189
-
190
-
191
-
192
-
193
-
194
-
195
-
196
-
197
-
198
-
199
-
200
-
201
-
202
-
203
-
204
-
205
-
206
-
207
-
208
-
209
-
210
-
211
-
212
-
213
-
214
-
215
-
216
-
217
-
218
-
219
-
220
-
221
-
222
-
223
-
224
-
225
-
226
-
227
-
228
-
229
-
230
-
231
-
232
-
233
-
234
-
235
-
236
-
237
-
238
-
239
-
240
-
241
-
242
-
243
-
244
-
245
-
246
-
247
-
248
-
249
-
250
-
251
-
252
-
253
-
254
-
255
-
256
-
257
-
258
-
259
-
260
-
261
-
262
-
263
-
264
-
265
-
266
-
267
-
268
-
269
-
270
-
271
-
272
-
273
-
274
-
275
-
276
-
277
-
278
-
279
-
280
-
281
-
282
 |
 |
adidas Group
/
2012 Annual Report
Group Management Report – Financial Review
140
2012
/
03.2
/
Group Business Performance
/
Statement of Financial Position and Statement of Cash Flows
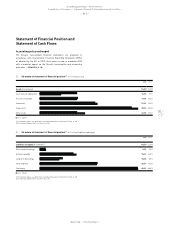
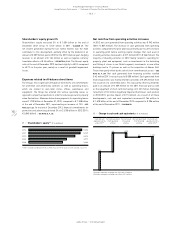
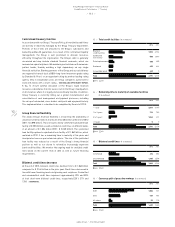
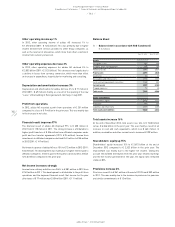
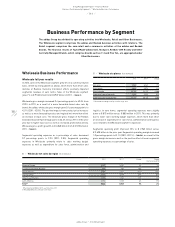
Shareholders’ equity grows 3%
Shareholders’ equity increased 3% to € 5.304 billion at the end of
December 2012 versus € 5.137 billion in 2011
/
DIAGRAM 39. The
net income generated during the last twelve months was the main
contributor to this development, partially offset by the dividend in an
amount of € 209 million paid in 2012 for the 2011 financial year, hedging
reserves in an amount of € 134 million as well as negative currency
translation effects of € 45 million
/
SEE NOTE 26, P. 221. The Group’s equity
ratio at the end of December 2012 declined slightly to 45.5% compared
to 45.7% in the prior year, mainly as a result of goodwill impairment
losses.
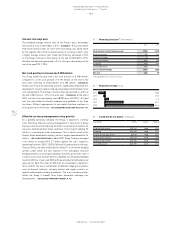
Expenses related to off-balance sheet items
The Group’s most significant off-balance sheet items are commitments
for promotion and advertising contracts as well as operating leases,
which are related to own-retail stores, offices, warehouses and
equipment. The Group has entered into various operating leases as
opposed to property acquisitions in order to reduce exposure to property
value fluctuations. Minimum future lease payments for operating leases
were € 1.798 billion at December 31, 2012, compared to € 1.558 billion
at the end of December 2011, representing an increase of 15%
/
SEE
NOTE 28, P. 223. At the end of December 2012, financial commitments for
promotion and advertising declined 2% to € 3.768 billion in 2012 (2011:
€ 3.843 billion)
/
SEE NOTE 38, P. 236.
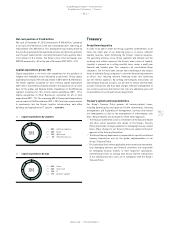
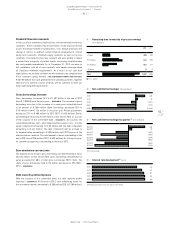
Net cash flow from operating activities increases
In 2012, net cash generated from operating activities was € 942 million
(2011: € 807 million). The increase in cash generated from operating
activities compared to the prior year was primarily due to a 21% increase
in operating profit before working capital changes. Net cash used in
investing activities decreased to € 217 million (2011: € 566 million). The
majority of investing activities in 2012 mainly related to spending for
property, plant and equipment, such as investments in the furnishing
and fitting of stores in our Retail segment, investments in new office
buildings and in IT systems as well as the acquisition of Adams Golf.
These were partly offset by the sale of short-term financial assets
/
SEE
NOTE 04, P. 209. Net cash generated from financing activities totalled
€ 42 million (2011: net cash used of € 500 million). Cash generated from
financing activities was mainly related to proceeds of € 496 million from
the issuance of a convertible bond. This was partly offset by dividends
paid in an amount of € 209 million for the 2011 financial year as well
as the repayment of short-term borrowings of € 231 million. Exchange
rate effects of € 3 million negatively impacted the Group’s cash position
in 2012 (2011: positive impact of € 15 million). As a result of all these
developments, cash and cash equivalents increased € 764 million to
€ 1.670 billion at the end of December 2012 compared to € 906 million
at the end of December 2011
/
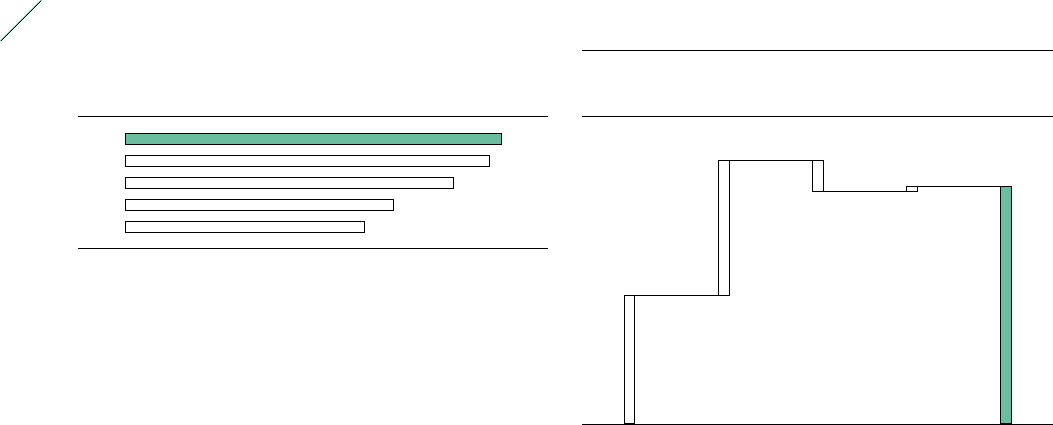
DIAGRAM 40.
40
/
Change in cash and cash equivalents (€ in millions)
Cash and cash
equivalents at the
end of 2011 1)
Net cash generated
from operating
activities
Net cash used
in investing
activities
Net cash generated
from financing
activities
Cash and cash
equivalents at the
end of 2012 2)
1) Includes a positive exchange rate effect of € 15 million.
2) Includes a negative exchange rate effect of € 3 million.
906
942 (217)
42 1,670
39
/
Shareholders’ equity 1) (€ in millions)
2012 5,304
2011 5,137
2010 4,616
2009 3,771
2008 3,386
1) 2011 restated according to IAS 8, see Note 03, p. 203. Prior years are not restated, see p. 131.