Reebok 2012 Annual Report Download - page 168
Download and view the complete annual report
Please find page 168 of the 2012 Reebok annual report below. You can navigate through the pages in the report by either clicking on the pages listed below, or by using the keyword search tool below to find specific information within the annual report.-
 1
1 -
2
-
3
-
4
-
5
-
6
-
7
-
8
-
9
-
10
-
11
-
12
-
13
-
14
-
15
-
16
-
17
-
18
-
19
-
20
-
21
-
22
-
23
-
24
-
25
-
26
-
27
-
28
-
29
-
30
-
31
-
32
-
33
-
34
-
35
-
36
-
37
-
38
-
39
-
40
-
41
-
42
-
43
-
44
-
45
-
46
-
47
-
48
-
49
-
50
-
51
-
52
-
53
-
54
-
55
-
56
-
57
-
58
-
59
-
60
-
61
-
62
-
63
-
64
-
65
-
66
-
67
-
68
-
69
-
70
-
71
-
72
-
73
-
74
-
75
-
76
-
77
-
78
-
79
-
80
-
81
-
82
-
83
-
84
-
85
-
86
-
87
-
88
-
89
-
90
-
91
-
92
-
93
-
94
-
95
-
96
-
97
-
98
-
99
-
100
-
101
-
102
-
103
-
104
-
105
-
106
-
107
-
108
-
109
-
110
-
111
-
112
-
113
-
114
-
115
-
116
-
117
-
118
-
119
-
120
-
121
-
122
-
123
-
124
-
125
-
126
-
127
-
128
-
129
-
130
-
131
-
132
-
133
-
134
-
135
-
136
-
137
-
138
-
139
-
140
-
141
-
142
-
143
-
144
-
145
-
146
-
147
-
148
-
149
-
150
-
151
-
152
-
153
-
154
-
155
-
156
-
157
-
 158
158 -
 159
159 -
 160
160 -
 161
161 -
 162
162 -
 163
163 -
 164
164 -
 165
165 -
 166
166 -
 167
167 -
 168
168 -
 169
169 -
 170
170 -
 171
171 -
 172
172 -
 173
173 -
 174
174 -
 175
175 -
 176
176 -
 177
177 -
 178
178 -
179
-
180
-
181
-
182
-
183
-
184
-
185
-
186
-
187
-
188
-
189
-
190
-
191
-
192
-
193
-
194
-
195
-
196
-
197
-
198
-
199
-
200
-
201
-
202
-
203
-
204
-
205
-
206
-
207
-
208
-
209
-
210
-
211
-
212
-
213
-
214
-
215
-
216
-
217
-
218
-
219
-
220
-
221
-
222
-
223
-
224
-
225
-
226
-
227
-
228
-
229
-
230
-
231
-
232
-
233
-
234
-
235
-
236
-
237
-
238
-
239
-
240
-
241
-
242
-
243
-
244
-
245
-
246
-
247
-
248
-
249
-
250
-
251
-
252
-
253
-
254
-
255
-
256
-
257
-
258
-
259
-
260
-
261
-
262
-
263
-
264
-
265
-
266
-
267
-
268
-
269
-
270
-
271
-
272
-
273
-
274
-
275
-
276
-
277
-
278
-
279
-
280
-
281
-
282
 |
 |
adidas Group
/
2012 Annual Report
Group Management Report – Financial Review
146
2012
/
03.2
/
Group Business Performance
/
Financial Statements and Management Report of adidas AG
Other operating income up 1%
In 2012, other operating income of adidas AG increased 1% to
€ 1.270 billion (2011: € 1.254 billion). This was primarily due to higher
income derived from services provided to other Group companies as
well as the reversal of allowances, which more than offset a decline in
income from currency conversion.
Other operating expenses decrease 3%
In 2012, other operating expenses for adidas AG declined 3% to
€ 2.055 billion (2011: € 2.125 billion). This decrease was largely due to
a decline in losses from currency conversion, which more than offset
an increase in expenditure, in particular for marketing and consulting.
Depreciation and amortisation increases 3%
Depreciation and amortisation for adidas AG rose 3% to € 71 million in
2012 (2011: € 69 million), mainly as a result of the opening of the new
“Laces” office building in Herzogenaurach, Germany, in July 2011.
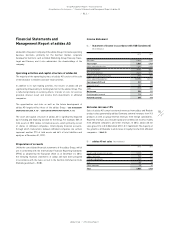
Profit from operations
In 2012, adidas AG recorded a profit from operations of € 231 million
compared to a loss of € 9 million in the prior year. This was mainly due
to the increase in net sales.
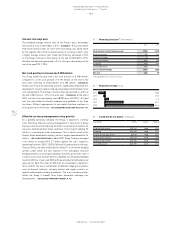
Financial result improves 97%
The financial result of adidas AG improved 97% to € 350 million in
2012 from € 178 million in 2011. The strong increase is attributable to
higher profit transfers of € 336 million from affiliated companies under
profit and loss transfer agreements (2011: € 94 million). Income from
investments in affiliated companies declined € 61 million to € 86 million
in 2012 (2011: € 147 million).
Net interest expense of adidas AG rose 15% to € 72 million in 2012 (2011:
€ 63 million). This development was mainly due to higher interest paid to
affiliated companies. Interest paid to third parties decreased € 4 million
to € 36 million compared to the prior year.
Net income increases strongly
Income from ordinary activities rose 244% to € 581 million in 2012 from
€ 169 million in 2011. This development is attributable to the profit from
operations and the improved financial result. Net income for the year
after taxes of € 77 million was € 504 million (2011: € 111 million).
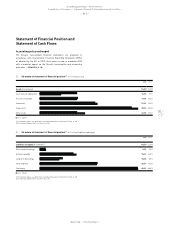
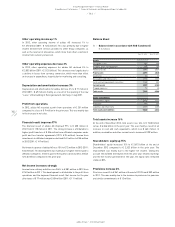
Balance Sheet
Total assets increase 16%
At the end of December 2012, total assets rose 16% to € 7.030 billion
versus € 6.046 billion in the prior year. This was mainly a result of an
increase in cash and cash equivalents, which rose € 665 million. In
addition, receivables and other current assets increased € 209 million.
Shareholders’ equity up 15%
Shareholders’ equity increased 15% to € 2.672 billion at the end of
December 2012 compared to € 2.322 billion in the prior year. The
improvement was mainly due to the higher net income. Taking into
account the dividend distribution from the prior year retained earnings
and the net income generated for the year, the equity ratio remained
stable at 38%.
Provisions increase 6%
Provisions rose 6% to € 361 million at the end of 2012 from € 339 million
in 2011. This was mainly due to the increase in provisions for pensions
and similar commitments of € 12 million.
56
/
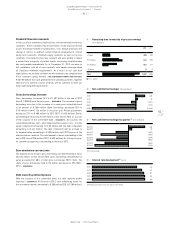
Balance sheet in accordance with HGB (Condensed)
(€ in millions)
Dec. 31, 2012 Dec. 31, 2011
Assets
Intangible assets 152 154
Property, plant and equipment 265 255
Financial assets 3,480 3,429
Fixed assets 3,897 3,838
Inventories 33 30
Receivables and other assets 1,976 1,767
Cash and cash equivalents, securities 1,048 383
Current assets 3,057 2,180
Prepaid expenses 76 28
Total assets 7,030 6,046
Equity and liabilities
Shareholders’ equity 2,672 2,322
Provisions 361 339
Liabilities and other items 3,997 3,385
Total equity and liabilities 7,030 6,046