Reebok 2012 Annual Report Download - page 223
Download and view the complete annual report
Please find page 223 of the 2012 Reebok annual report below. You can navigate through the pages in the report by either clicking on the pages listed below, or by using the keyword search tool below to find specific information within the annual report.-
 1
1 -
2
-
3
-
4
-
5
-
6
-
7
-
8
-
9
-
10
-
11
-
12
-
13
-
14
-
15
-
16
-
17
-
18
-
19
-
20
-
21
-
22
-
23
-
24
-
25
-
26
-
27
-
28
-
29
-
30
-
31
-
32
-
33
-
34
-
35
-
36
-
37
-
38
-
39
-
40
-
41
-
42
-
43
-
44
-
45
-
46
-
47
-
48
-
49
-
50
-
51
-
52
-
53
-
54
-
55
-
56
-
57
-
58
-
59
-
60
-
61
-
62
-
63
-
64
-
65
-
66
-
67
-
68
-
69
-
70
-
71
-
72
-
73
-
74
-
75
-
76
-
77
-
78
-
79
-
80
-
81
-
82
-
83
-
84
-
85
-
86
-
87
-
88
-
89
-
90
-
91
-
92
-
93
-
94
-
95
-
96
-
97
-
98
-
99
-
100
-
101
-
102
-
103
-
104
-
105
-
106
-
107
-
108
-
109
-
110
-
111
-
112
-
113
-
114
-
115
-
116
-
117
-
118
-
119
-
120
-
121
-
122
-
123
-
124
-
125
-
126
-
127
-
128
-
129
-
130
-
131
-
132
-
133
-
134
-
135
-
136
-
137
-
138
-
139
-
140
-
141
-
142
-
143
-
144
-
145
-
146
-
147
-
148
-
149
-
150
-
151
-
152
-
153
-
154
-
155
-
156
-
157
-
158
-
159
-
160
-
161
-
162
-
163
-
164
-
165
-
166
-
167
-
168
-
169
-
170
-
171
-
172
-
173
-
174
-
175
-
176
-
177
-
178
-
179
-
180
-
181
-
182
-
183
-
184
-
185
-
186
-
187
-
188
-
189
-
190
-
191
-
192
-
193
-
194
-
195
-
196
-
197
-
198
-
199
-
200
-
201
-
202
-
203
-
204
-
205
-
206
-
207
-
208
-
209
-
210
-
211
-
212
-
 213
213 -
 214
214 -
 215
215 -
 216
216 -
 217
217 -
 218
218 -
 219
219 -
 220
220 -
 221
221 -
 222
222 -
 223
223 -
 224
224 -
 225
225 -
 226
226 -
 227
227 -
 228
228 -
 229
229 -
 230
230 -
 231
231 -
 232
232 -
 233
233 -
234
-
235
-
236
-
237
-
238
-
239
-
240
-
241
-
242
-
243
-
244
-
245
-
246
-
247
-
248
-
249
-
250
-
251
-
252
-
253
-
254
-
255
-
256
-
257
-
258
-
259
-
260
-
261
-
262
-
263
-
264
-
265
-
266
-
267
-
268
-
269
-
270
-
271
-
272
-
273
-
274
-
275
-
276
-
277
-
278
-
279
-
280
-
281
-
282
 |
 |

adidas Group
/
2012 Annual Report
Consolidated Financial Statements
201
2012
Notes
/
04.8
/
Discount rates are based on a weighted average cost of capital calculation
considering a five-year average market-weighted debt/equity structure
and financing costs referencing the Group’s major competitors for each
cash-generating unit (or groups of units). The discount rates used are
after-tax rates and reflect the specific equity and country risk of the
relevant cash-generating unit.
As a result of the financial irregularities identified in spring 2012, the
total goodwill of € 27 million allocated to the geographic region India was
retroactively impaired as of January 1, 2011 as part of the adjustments
according to IAS 8
/
SEE NOTE 03.
In total, goodwill impairment losses of € 265 million have been
recognised in 2012 (2011: € 0 million). Within wholesale cash-generating
units, goodwill impairment losses amounted to € 106 million in North
America, € 41 million in Latin America, € 15 million in Brazil and
€ 11 million in Iberia. The goodwill of the respective cash-generating
units is completely impaired except for the cash-generating unit
Wholesale Iberia. The impairment losses were mainly caused by
adjusted growth assumptions for the Reebok brand, especially in North
America, Latin America and Brazil, and an increase in the country-
specific discount rates as a result of the euro crisis.
In addition, goodwill of € 68 million allocated to Reebok-CCM
Hockey was completely impaired and € 24 million allocated to Rockport
was partially impaired. The impairment losses are the result of changes
in the re-evaluation of future growth prospects and, with regard to
Rockport, also due to an increase in the discount rate.
Even a small change in the discount rate or a reduction of planned
cash inflows would result in an additional impairment requirement of
up to € 52 million for the cash-generating units (or groups of units)
Wholesale Iberia and Rockport. For all other cash-generating units,
even an increase in the discount rate of up to 1.5% or a reduction of
cash inflows of up to 20% would not result in any additional impairment
requirement.
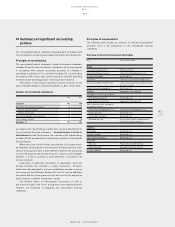
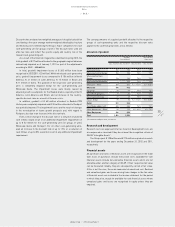
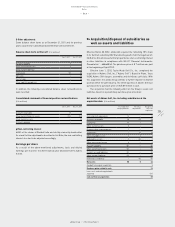
The carrying amounts of acquired goodwill allocated to the respective
groups of cash-generating units and the respective discount rates
applied to the cash flow projections are as follows:
Allocation of goodwill
Goodwill
(€ in millions)
Discount rate
(after taxes)
Dec. 31, 2012 Dec. 31, 2011 1) Dec. 31, 2012 Dec. 31, 2011
Wholesale China 160 162 8.1% 7.9%
Wholesale Central Europe 154 155 7.5% 7.3%
Wholesale Northern
Europe 133 134 7.4% 7.2%
Wholesale North America – 105 7.2% 7.0%
Wholesale – Other 287 357 7.2 – 11.3% 7.0 – 10.5%
Wholesale 734 913
Retail CIS 78 79 9.6% 9.5%
Retail North America 29 30 7.2% 7.0%
Retail Central Europe 29 29 7.5% 7.3%
Retail - Other 95 96 7.2 – 11.3% 7.0 – 10.5%
Retail 231 234
TaylorMade-adidas Golf 288 284 7.6% 7.3%
Other Businesses - Other 28 122 6.5 – 8.0% 6.5 – 7.5%
Other Businesses 316 406
Total 1,281 1,553
1) Restated according to IAS 8, see Note 03.
Research and development
Research costs are expensed in full as incurred. Development costs are
also expensed as incurred if they do not meet the recognition criteria of
IAS 38 “Intangible Assets”.
The Group spent € 128 million and € 115 million on product research
and development for the years ending December 31, 2012 and 2011,
respectively.
Financial assets
All purchases and sales of financial assets are recognised on the trade
date. Costs of purchases include transaction costs. Available-for-sale
financial assets include non-derivative financial assets which are not
allocable under another category of IAS 39. If their respective fair value
can be measured reliably, they are subsequently carried at fair value.
If this is not the case, these are measured at amortised cost. Realised
and unrealised gains and losses arising from changes in the fair value
of financial assets are included in the income statement for the period
in which they arise, except for available-for-sale financial assets where
unrealised gains and losses are recognised in equity unless they are
impaired.