Reebok 2012 Annual Report Download - page 161
Download and view the complete annual report
Please find page 161 of the 2012 Reebok annual report below. You can navigate through the pages in the report by either clicking on the pages listed below, or by using the keyword search tool below to find specific information within the annual report.-
 1
1 -
2
-
3
-
4
-
5
-
6
-
7
-
8
-
9
-
10
-
11
-
12
-
13
-
14
-
15
-
16
-
17
-
18
-
19
-
20
-
21
-
22
-
23
-
24
-
25
-
26
-
27
-
28
-
29
-
30
-
31
-
32
-
33
-
34
-
35
-
36
-
37
-
38
-
39
-
40
-
41
-
42
-
43
-
44
-
45
-
46
-
47
-
48
-
49
-
50
-
51
-
52
-
53
-
54
-
55
-
56
-
57
-
58
-
59
-
60
-
61
-
62
-
63
-
64
-
65
-
66
-
67
-
68
-
69
-
70
-
71
-
72
-
73
-
74
-
75
-
76
-
77
-
78
-
79
-
80
-
81
-
82
-
83
-
84
-
85
-
86
-
87
-
88
-
89
-
90
-
91
-
92
-
93
-
94
-
95
-
96
-
97
-
98
-
99
-
100
-
101
-
102
-
103
-
104
-
105
-
106
-
107
-
108
-
109
-
110
-
111
-
112
-
113
-
114
-
115
-
116
-
117
-
118
-
119
-
120
-
121
-
122
-
123
-
124
-
125
-
126
-
127
-
128
-
129
-
130
-
131
-
132
-
133
-
134
-
135
-
136
-
137
-
138
-
139
-
140
-
141
-
142
-
143
-
144
-
145
-
146
-
147
-
148
-
149
-
150
-
 151
151 -
 152
152 -
 153
153 -
 154
154 -
 155
155 -
 156
156 -
 157
157 -
 158
158 -
 159
159 -
 160
160 -
 161
161 -
 162
162 -
 163
163 -
 164
164 -
 165
165 -
 166
166 -
 167
167 -
 168
168 -
 169
169 -
 170
170 -
 171
171 -
172
-
173
-
174
-
175
-
176
-
177
-
178
-
179
-
180
-
181
-
182
-
183
-
184
-
185
-
186
-
187
-
188
-
189
-
190
-
191
-
192
-
193
-
194
-
195
-
196
-
197
-
198
-
199
-
200
-
201
-
202
-
203
-
204
-
205
-
206
-
207
-
208
-
209
-
210
-
211
-
212
-
213
-
214
-
215
-
216
-
217
-
218
-
219
-
220
-
221
-
222
-
223
-
224
-
225
-
226
-
227
-
228
-
229
-
230
-
231
-
232
-
233
-
234
-
235
-
236
-
237
-
238
-
239
-
240
-
241
-
242
-
243
-
244
-
245
-
246
-
247
-
248
-
249
-
250
-
251
-
252
-
253
-
254
-
255
-
256
-
257
-
258
-
259
-
260
-
261
-
262
-
263
-
264
-
265
-
266
-
267
-
268
-
269
-
270
-
271
-
272
-
273
-
274
-
275
-
276
-
277
-
278
-
279
-
280
-
281
-
282
 |
 |

adidas Group
/
2012 Annual Report
Group Management Report – Financial Review
139
2012
/
03.2
/
Group Business Performance
/
Statement of Financial Position and Statement of Cash Flows
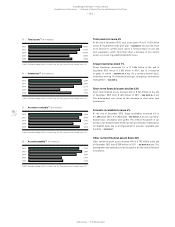
Other current assets up 4%
Other current assets increased 4% to € 489 million at the end of
December 2012 from € 469 million in 2011, as a result of advanced
inventory payments, partly offset by a decrease in prepaid promotion
contracts
/
SEE NOTE 10, P. 213.
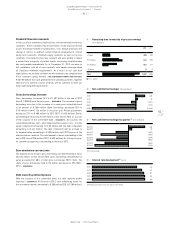
Fixed assets decrease 3%
Fixed assets decreased 3% to € 4.139 billion at the end of December
2012 versus € 4.276 billion in 2011. Fixed assets include property, plant
and equipment, goodwill, trademarks and other intangible assets as well
as long-term financial assets. Currency translation effects in an amount
of € 43 million negatively impacted the development of fixed assets.
Additions in an amount of € 471 million were primarily related to the
continued expansion of our own-retail activities, the construction of the
European Distribution Centre near Osnabrueck, Germany, investments
into the Group’s IT infrastructure as well as the further development
of the Group’s headquarters in Herzogenaurach. Additions were more
than offset by the goodwill impairment of € 265 million, depreciation
and amortisation amounting to € 268 million, as well as disposals of
€ 33 million.
Goodwill decreases 17%
The majority of goodwill is primarily related to the acquisition of
the Reebok business in 2006. At the end of December 2012, goodwill
decreased 17% to € 1.281 billion from € 1.553 billion in the prior year.
The decrease is mainly related to goodwill impaired of € 265 million, of
which € 173 million is related to the Wholesale segment and € 92 million
is related to Other Businesses
/
SEE NOTE 02, P. 197
/
SEE NOTE 13, P. 214.
Assets held for sale decrease 55%
At the end of December 2012, assets held for sale declined 55% to
€ 11 million compared to € 25 million in 2011. This decrease was mainly
due to the sale of Immobilieninvest und Betriebsgesellschaft Herzo
Base GmbH & Co. KG in 2012
/
SEE NOTE 11, P. 213.
Other non-current financial assets down 49%
Other non-current financial assets decreased 49% to € 21 million at
the end of December 2012 from € 42 million in 2011, mainly driven by
a decline in the fair value of financial instruments
/
SEE NOTE 16, P. 215.
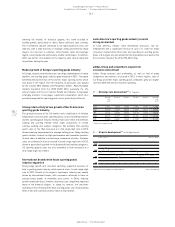
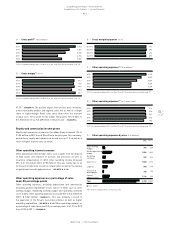
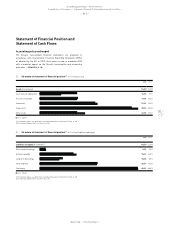
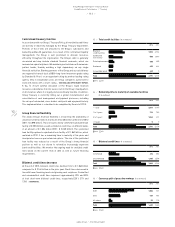
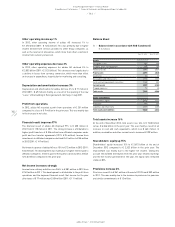
Accounts payable decrease 5%
Accounts payable were down 5% to € 1.790 billion at the end of
December 2012 versus € 1.887 billion at the end of 2011
/
DIAGRAM 38.
On a currency-neutral basis, accounts payable decreased 4%, reflecting
the Group’s focus on inventory management as well as phasing of
sourcing activities.
Other current financial liabilities increase 24%
At the end of December 2012, other current financial liabilities increased
24% to € 83 million from € 66 million in 2011, primarily as a result of the
increase in the negative fair value of financial instruments
/
SEE NOTE 19,
P. 216.
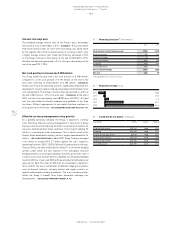
Other current provisions up 3%
Other current provisions were up 3% to € 563 million at the end of 2012
versus € 549 million at the end of 2011. This primarily relates to an
increase in provisions for returns, allowances and warranties as well
as customs risks, partly offset by a decrease in provisions for employee
benefits
/
SEE NOTE 20, P. 217.
Current accrued liabilities grow 9%
Current accrued liabilities increased 9% to € 1.084 billion at the end of
2012 from € 992 million in 2011, mainly due to an increase in accruals
for personnel costs and customer discounts
/
SEE NOTE 21, P. 217.
Other current liabilities down 1%
Other current liabilities were down 1% to € 299 million at the end of
2012 from € 303 million in 2011, mainly due to a decrease in accruals for
customer prepayments as well as an increase in tax liabilities other than
income taxes
/
SEE NOTE 22, P. 218.
Long-term borrowings grow 22%
At the end of December 2012, long-term borrowings grew 22% to
€ 1.207 billion from € 991 million in the prior year. The increase primarily
relates to the issuance of a convertible bond of € 500 million in March
2012
/
SEE NOTE 18, P. 215, which was partly offset by a reduction of private
placements which matured during the year.