Reebok 2012 Annual Report Download - page 172
Download and view the complete annual report
Please find page 172 of the 2012 Reebok annual report below. You can navigate through the pages in the report by either clicking on the pages listed below, or by using the keyword search tool below to find specific information within the annual report.-
 1
1 -
2
-
3
-
4
-
5
-
6
-
7
-
8
-
9
-
10
-
11
-
12
-
13
-
14
-
15
-
16
-
17
-
18
-
19
-
20
-
21
-
22
-
23
-
24
-
25
-
26
-
27
-
28
-
29
-
30
-
31
-
32
-
33
-
34
-
35
-
36
-
37
-
38
-
39
-
40
-
41
-
42
-
43
-
44
-
45
-
46
-
47
-
48
-
49
-
50
-
51
-
52
-
53
-
54
-
55
-
56
-
57
-
58
-
59
-
60
-
61
-
62
-
63
-
64
-
65
-
66
-
67
-
68
-
69
-
70
-
71
-
72
-
73
-
74
-
75
-
76
-
77
-
78
-
79
-
80
-
81
-
82
-
83
-
84
-
85
-
86
-
87
-
88
-
89
-
90
-
91
-
92
-
93
-
94
-
95
-
96
-
97
-
98
-
99
-
100
-
101
-
102
-
103
-
104
-
105
-
106
-
107
-
108
-
109
-
110
-
111
-
112
-
113
-
114
-
115
-
116
-
117
-
118
-
119
-
120
-
121
-
122
-
123
-
124
-
125
-
126
-
127
-
128
-
129
-
130
-
131
-
132
-
133
-
134
-
135
-
136
-
137
-
138
-
139
-
140
-
141
-
142
-
143
-
144
-
145
-
146
-
147
-
148
-
149
-
150
-
151
-
152
-
153
-
154
-
155
-
156
-
157
-
158
-
159
-
160
-
161
-
 162
162 -
 163
163 -
 164
164 -
 165
165 -
 166
166 -
 167
167 -
 168
168 -
 169
169 -
 170
170 -
 171
171 -
 172
172 -
 173
173 -
 174
174 -
 175
175 -
 176
176 -
 177
177 -
 178
178 -
 179
179 -
 180
180 -
 181
181 -
 182
182 -
183
-
184
-
185
-
186
-
187
-
188
-
189
-
190
-
191
-
192
-
193
-
194
-
195
-
196
-
197
-
198
-
199
-
200
-
201
-
202
-
203
-
204
-
205
-
206
-
207
-
208
-
209
-
210
-
211
-
212
-
213
-
214
-
215
-
216
-
217
-
218
-
219
-
220
-
221
-
222
-
223
-
224
-
225
-
226
-
227
-
228
-
229
-
230
-
231
-
232
-
233
-
234
-
235
-
236
-
237
-
238
-
239
-
240
-
241
-
242
-
243
-
244
-
245
-
246
-
247
-
248
-
249
-
250
-
251
-
252
-
253
-
254
-
255
-
256
-
257
-
258
-
259
-
260
-
261
-
262
-
263
-
264
-
265
-
266
-
267
-
268
-
269
-
270
-
271
-
272
-
273
-
274
-
275
-
276
-
277
-
278
-
279
-
280
-
281
-
282
 |
 |
3
adidas Group
/
2012 Annual Report
Group Management Report – Financial Review
150
2012
/
03.3
/
Business Performance by Segment
/
Wholesale Business Performance
Business Performance by Segment
The adidas Group has divided its operating activities into Wholesale, Retail and Other Businesses.
The Wholesale segment comprises the adidas and Reebok business activities with retailers. The
Retail segment comprises the own-retail and e-commerce activities of the adidas and Reebok
brands. The financial results of TaylorMade-adidas Golf, Rockport, Reebok-CCM Hockey and Other
Centrally Managed Brands, which comprise brands such as Y-3 and Five Ten, are aggregated under
Other Businesses.
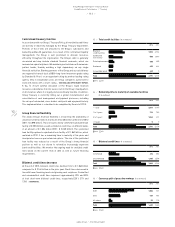
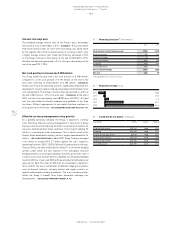
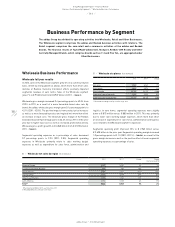
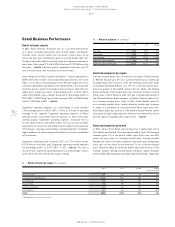
Wholesale Business Performance
Wholesale full year results
In 2012, sales in the Wholesale segment grew 2% on a currency-neutral
basis, driven by strong growth at adidas, which more than offset sales
declines at Reebok. Currency translation effects positively impacted
segmental revenues in euro terms. Sales in the Wholesale segment
grew 7% to € 9.533 billion from € 8.949 billion in 2011
/
TABLE 01.
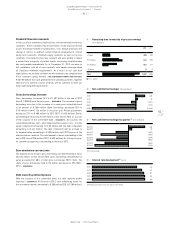
Wholesale gross margin increased 0.4 percentage points to 40.3% from
39.9% in 2011, as a result of a more favourable brand sales mix. By
brand, the adidas wholesale gross margin grew 0.1 percentage points to
42.1% (2011: 42.0%). The positive impacts from product price increases
as well as a more favourable product and regional mix more than offset
an increase in input costs. The wholesale gross margin of the Reebok
brand decreased 2.9 percentage points to 26.2% versus 29.1% in the prior
year due to higher input costs as well as increased promotional activity.
Wholesale gross profit grew 8% to € 3.840 billion from € 3.570 billion in
2011
/
TABLE 01.
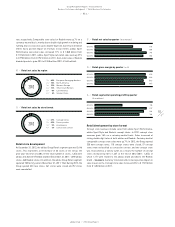
Segmental operating expenses as a percentage of sales decreased
0.7 percentage points to 9.2% (2011: 9.8%). Segmental operating
expenses in Wholesale primarily relate to sales working budget
expenses as well as expenditure for sales force, administration and
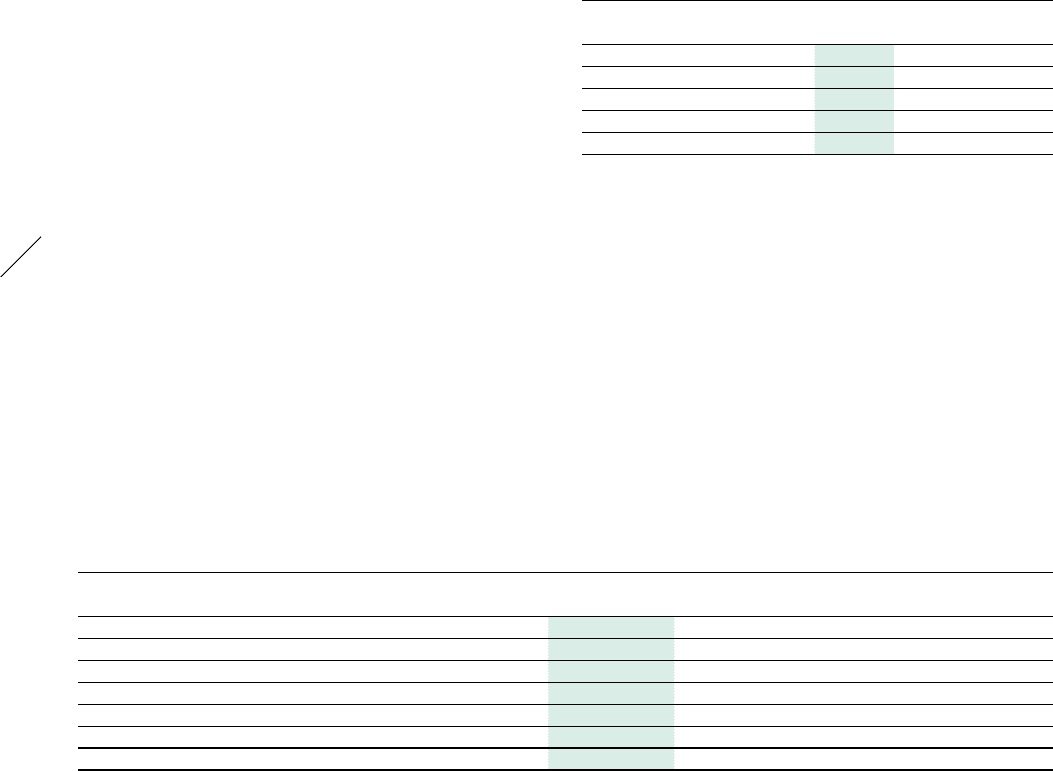
02
/
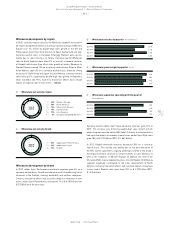
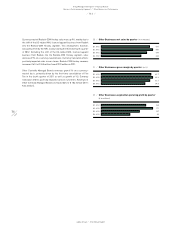
Wholesale net sales by region (€ in millions)
2012 2011 1) Change Change
(currency-neutral)
Western Europe 3,257 3,187 2% 1%
European Emerging Markets 545 496 10% 6%
North America 1,744 1,771 (1%) (9%)
Greater China 1,322 1,038 27% 15%
Other Asian Markets 1,493 1,332 12% 6%
Latin America 1,172 1,125 4% 5%
Total 2) 9,533 8,949 7% 2%
1) Restated according to IAS 8, see Note 03, p. 203.
2) Rounding differences may arise in totals.
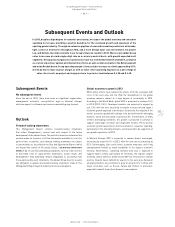
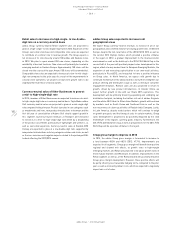
01
/
Wholesale at a glance (€ in millions)
2012 2011 1) Change
Net sales 9,533 8,949 7%
Gross profit 3,840 3,570 8%
Gross margin 40.3% 39.9% 0.4pp
Segmental operating profit 2,965 2,690 10%
Segmental operating margin 31.1% 30.1% 1.0pp
1) Restated according to IAS 8, see Note 03, p. 203.
logistics. In euro terms, segmental operating expenses were slightly
down to € 875 million versus € 880 million in 2011. This was primarily
due to lower sales working budget expenses, which more than offset
an increase in expenditure for sales force, administration and logistics
costs related to the Wholesale segment’s expansion.
Segmental operating profit improved 10% to € 2.965 billion versus
€ 2.690 billion in the prior year. Segmental operating margin increased
1.0 percentage points to 31.1% (2011: 30.1%)
/
TABLE 01, as a result of the
gross margin increase as well as the positive effect of lower segmental
operating expenses as a percentage of sales.