Reebok 2012 Annual Report Download - page 158
Download and view the complete annual report
Please find page 158 of the 2012 Reebok annual report below. You can navigate through the pages in the report by either clicking on the pages listed below, or by using the keyword search tool below to find specific information within the annual report.-
 1
1 -
2
-
3
-
4
-
5
-
6
-
7
-
8
-
9
-
10
-
11
-
12
-
13
-
14
-
15
-
16
-
17
-
18
-
19
-
20
-
21
-
22
-
23
-
24
-
25
-
26
-
27
-
28
-
29
-
30
-
31
-
32
-
33
-
34
-
35
-
36
-
37
-
38
-
39
-
40
-
41
-
42
-
43
-
44
-
45
-
46
-
47
-
48
-
49
-
50
-
51
-
52
-
53
-
54
-
55
-
56
-
57
-
58
-
59
-
60
-
61
-
62
-
63
-
64
-
65
-
66
-
67
-
68
-
69
-
70
-
71
-
72
-
73
-
74
-
75
-
76
-
77
-
78
-
79
-
80
-
81
-
82
-
83
-
84
-
85
-
86
-
87
-
88
-
89
-
90
-
91
-
92
-
93
-
94
-
95
-
96
-
97
-
98
-
99
-
100
-
101
-
102
-
103
-
104
-
105
-
106
-
107
-
108
-
109
-
110
-
111
-
112
-
113
-
114
-
115
-
116
-
117
-
118
-
119
-
120
-
121
-
122
-
123
-
124
-
125
-
126
-
127
-
128
-
129
-
130
-
131
-
132
-
133
-
134
-
135
-
136
-
137
-
138
-
139
-
140
-
141
-
142
-
143
-
144
-
145
-
146
-
147
-
 148
148 -
 149
149 -
 150
150 -
 151
151 -
 152
152 -
 153
153 -
 154
154 -
 155
155 -
 156
156 -
 157
157 -
 158
158 -
 159
159 -
 160
160 -
 161
161 -
 162
162 -
 163
163 -
 164
164 -
 165
165 -
 166
166 -
 167
167 -
 168
168 -
169
-
170
-
171
-
172
-
173
-
174
-
175
-
176
-
177
-
178
-
179
-
180
-
181
-
182
-
183
-
184
-
185
-
186
-
187
-
188
-
189
-
190
-
191
-
192
-
193
-
194
-
195
-
196
-
197
-
198
-
199
-
200
-
201
-
202
-
203
-
204
-
205
-
206
-
207
-
208
-
209
-
210
-
211
-
212
-
213
-
214
-
215
-
216
-
217
-
218
-
219
-
220
-
221
-
222
-
223
-
224
-
225
-
226
-
227
-
228
-
229
-
230
-
231
-
232
-
233
-
234
-
235
-
236
-
237
-
238
-
239
-
240
-
241
-
242
-
243
-
244
-
245
-
246
-
247
-
248
-
249
-
250
-
251
-
252
-
253
-
254
-
255
-
256
-
257
-
258
-
259
-
260
-
261
-
262
-
263
-
264
-
265
-
266
-
267
-
268
-
269
-
270
-
271
-
272
-
273
-
274
-
275
-
276
-
277
-
278
-
279
-
280
-
281
-
282
 |
 |
adidas Group
/
2012 Annual Report
Group Management Report – Financial Review
136
2012
/
03.2
/
Group Business Performance
/
Income Statement
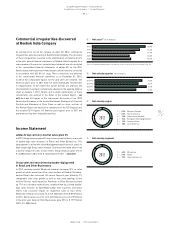
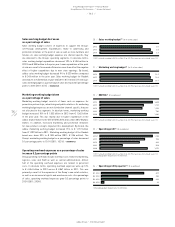
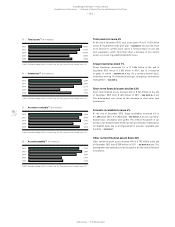
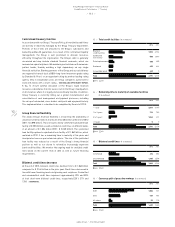
Income before taxes excluding goodwill
impairment up 28%
Income before taxes (IBT) for the adidas Group decreased 2% to
€ 851 million from € 869 million in 2011. IBT as a percentage of
sales decreased 0.8 percentage points to 5.7% in 2012 from 6.5% in
2011. Excluding the goodwill impairment losses, IBT was up 28% to
€ 1.116 billion
/
DIAGRAM 27 and, as a percentage of sales, increased
1.0 percentage points to 7.5%, primarily as a result of the Group’s
operating margin increase.
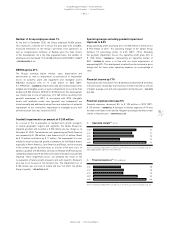
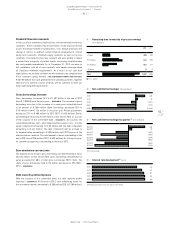
Net income attributable to shareholders excluding
goodwill impairment up 29%
The Group’s net income attributable to shareholders decreased to
€ 526 million in 2012 from € 613 million in 2011. This represents a
decrease of 14% versus the prior year level. Excluding the goodwill
impairment losses, net income attributable to shareholders was
€ 791 million, representing an increase of 29%
/
DIAGRAM 29. The Group’s
tax rate increased 8.4 percentage points to 38.4% in 2012 (2011: 30.0%),
mainly due to non-tax-deductible goodwill impairment losses. Excluding
the goodwill impairment losses, the effective tax rate was 29.3%
/
SEE
NOTE 34, P. 231.
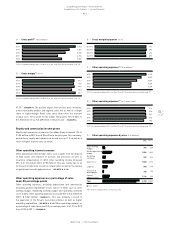
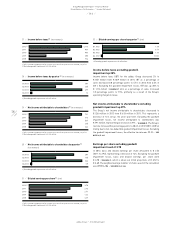
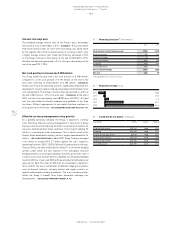
Earnings per share excluding goodwill
impairment reach € 3.78
In 2012, basic and diluted earnings per share amounted to € 2.52
(2011: € 2.93), representing a decrease of 14%. Excluding the goodwill
impairment losses, basic and diluted earnings per share were
€ 3.78
/
DIAGRAM 31, which is above our initial projections of € 3.52 to
€ 3.68. The weighted average number of shares used in the calculation
was 209,216,186
/
SEE NOTE 35, P. 232.
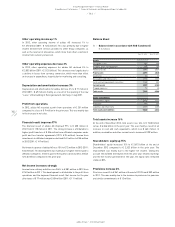
27
/
Income before taxes 1) (€ in millions)
2012 2) 1,116
2011 869
2010 806
2009 358
2008 904
1) 2011 restated according to IAS 8, see Note 03, p. 203. Prior years are not restated, see p. 131.
2) Excluding goodwill impairment of € 265 million.
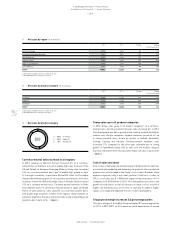
29
/
Net income attributable to shareholders 1) (€ in millions)
2012 2) 791
2011 613
2010 567
2009 245
2008 642
1) 2011 restated according to IAS 8, see Note 03, p. 203. Prior years are not restated, see p. 131.
2) Excluding goodwill impairment of € 265 million.
31
/
Diluted earnings per share 1) (in €)
2012 2) 3.78
2011 2.93
2010 2.71
2009 1.22
2008 3.07
1) 2011 restated according to IAS 8, see Note 03, p. 203. Prior years are not restated, see p. 131.
2) Excluding goodwill impairment of € 265 million.
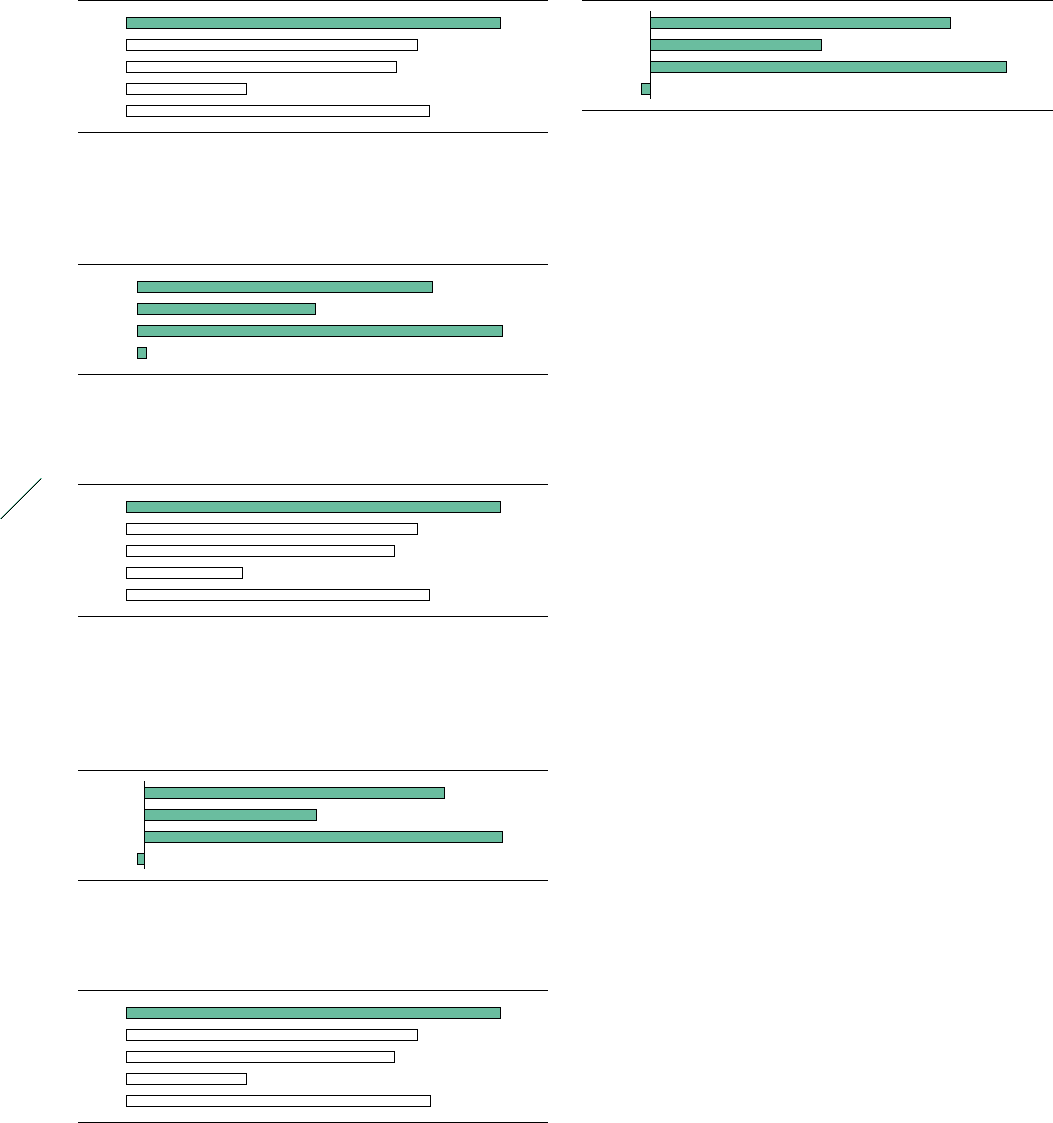
28
/
Income before taxes by quarter 1) (€ in millions)
Q1 2012 389
Q2 2012 235
Q3 2012 479
Q4 2012 12
1) Excluding goodwill impairment of € 265 million.
32
/
Diluted earnings per share by quarter 1) (in €)
Q1 2012 1.38
Q2 2012 0.79
Q3 2012 1.64
Q4 2012 (0.03)
1) Excluding goodwill impairment of € 265 million.
30
/
Net income attributable to shareholders by quarter 1)
(€ in millions)
Q1 2012 289
Q2 2012 165
Q3 2012 344
Q4 2012 (7)
1) Excluding goodwill impairment of € 265 million.