Reebok 2012 Annual Report Download - page 268
Download and view the complete annual report
Please find page 268 of the 2012 Reebok annual report below. You can navigate through the pages in the report by either clicking on the pages listed below, or by using the keyword search tool below to find specific information within the annual report.-
 1
1 -
2
-
3
-
4
-
5
-
6
-
7
-
8
-
9
-
10
-
11
-
12
-
13
-
14
-
15
-
16
-
17
-
18
-
19
-
20
-
21
-
22
-
23
-
24
-
25
-
26
-
27
-
28
-
29
-
30
-
31
-
32
-
33
-
34
-
35
-
36
-
37
-
38
-
39
-
40
-
41
-
42
-
43
-
44
-
45
-
46
-
47
-
48
-
49
-
50
-
51
-
52
-
53
-
54
-
55
-
56
-
57
-
58
-
59
-
60
-
61
-
62
-
63
-
64
-
65
-
66
-
67
-
68
-
69
-
70
-
71
-
72
-
73
-
74
-
75
-
76
-
77
-
78
-
79
-
80
-
81
-
82
-
83
-
84
-
85
-
86
-
87
-
88
-
89
-
90
-
91
-
92
-
93
-
94
-
95
-
96
-
97
-
98
-
99
-
100
-
101
-
102
-
103
-
104
-
105
-
106
-
107
-
108
-
109
-
110
-
111
-
112
-
113
-
114
-
115
-
116
-
117
-
118
-
119
-
120
-
121
-
122
-
123
-
124
-
125
-
126
-
127
-
128
-
129
-
130
-
131
-
132
-
133
-
134
-
135
-
136
-
137
-
138
-
139
-
140
-
141
-
142
-
143
-
144
-
145
-
146
-
147
-
148
-
149
-
150
-
151
-
152
-
153
-
154
-
155
-
156
-
157
-
158
-
159
-
160
-
161
-
162
-
163
-
164
-
165
-
166
-
167
-
168
-
169
-
170
-
171
-
172
-
173
-
174
-
175
-
176
-
177
-
178
-
179
-
180
-
181
-
182
-
183
-
184
-
185
-
186
-
187
-
188
-
189
-
190
-
191
-
192
-
193
-
194
-
195
-
196
-
197
-
198
-
199
-
200
-
201
-
202
-
203
-
204
-
205
-
206
-
207
-
208
-
209
-
210
-
211
-
212
-
213
-
214
-
215
-
216
-
217
-
218
-
219
-
220
-
221
-
222
-
223
-
224
-
225
-
226
-
227
-
228
-
229
-
230
-
231
-
232
-
233
-
234
-
235
-
236
-
237
-
238
-
239
-
240
-
241
-
242
-
243
-
244
-
245
-
246
-
247
-
248
-
249
-
250
-
251
-
252
-
253
-
254
-
255
-
256
-
257
-
 258
258 -
 259
259 -
 260
260 -
 261
261 -
 262
262 -
 263
263 -
 264
264 -
 265
265 -
 266
266 -
 267
267 -
 268
268 -
 269
269 -
 270
270 -
 271
271 -
 272
272 -
 273
273 -
 274
274 -
 275
275 -
 276
276 -
 277
277 -
 278
278 -
279
-
280
-
281
-
282
 |
 |
1
adidas Group
/
2012 Annual Report
Additional Information
246
2012
/
05.1
/
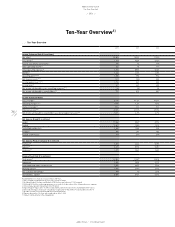
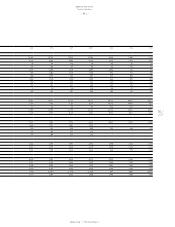
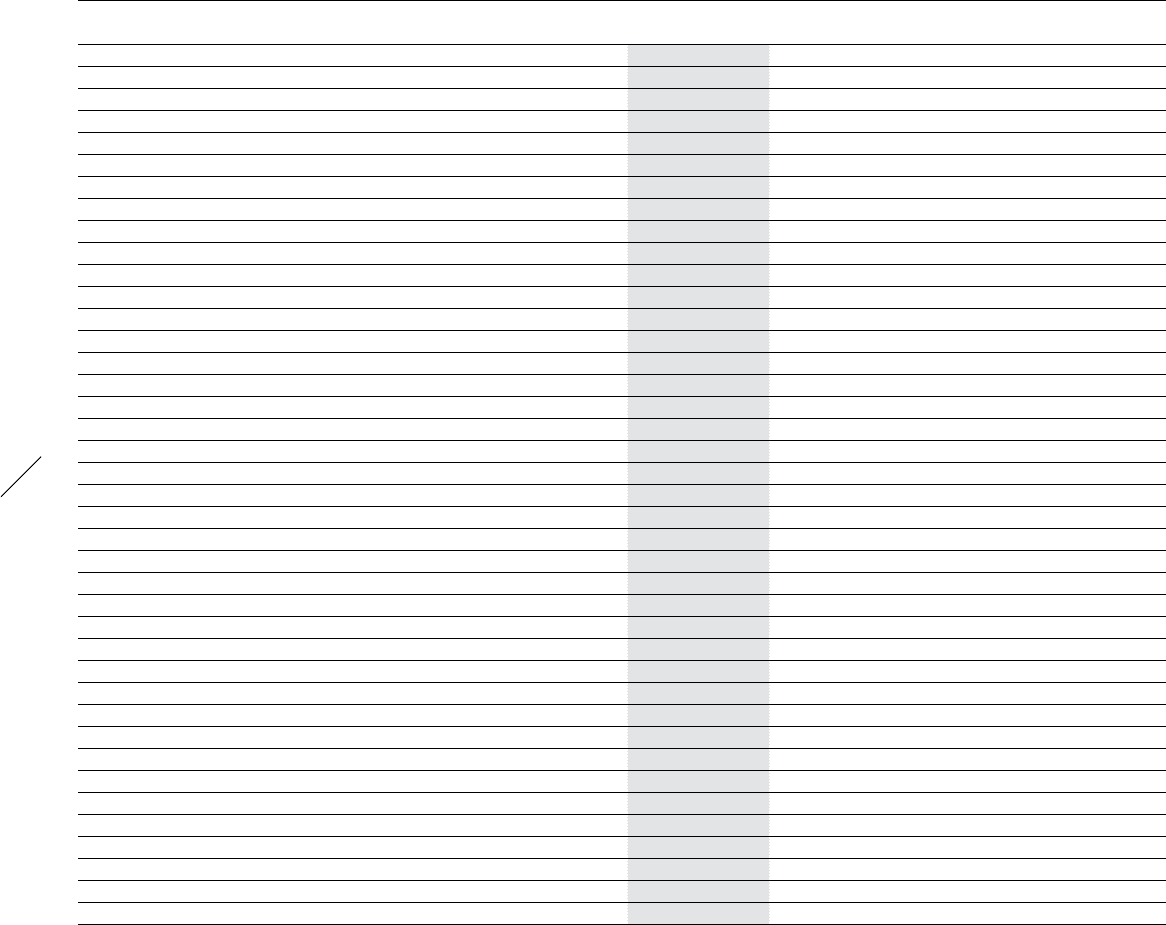
Ten-Year Overview
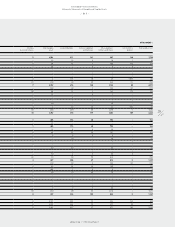
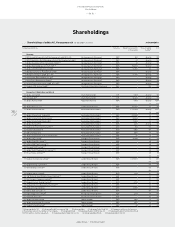
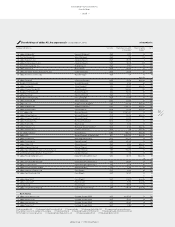
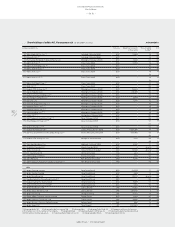
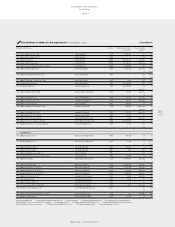
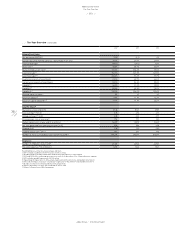
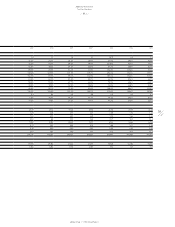
Ten-Year Overview 1)
Rounding differences may arise in percentages and totals.
1) 2011 restated according to IAS 8. Prior years are not restated.
2) Including Reebok, Rockport and Reebok-CCM Hockey from February 1, 2006 onwards.
3) 2004 and 2005 reflect continuing operations as a result of the divestiture of the Salomon business segment.
4) 2012 excludes goodwill impairment of € 265 million.
5) Operating profit figures prior to 2004 exclude royalty and commission income and goodwill amortisation.
6) 2003 and 2004 figures have been restated due to application of IAS 32/IAS 39 and amendment to IAS 19.
7) Includes income from continuing and discontinued operations.
8) Figures adjusted for 1:4 share split conducted on June 6, 2006.
9) Subject to Annual General Meeting approval.
..
/
Ten-Year Overview
2012 2011 2010
Income Statement Data (€ in millions)
Net sales 3) 14,883 13,322 11,990
Gross profit 3) 7,103 6,329 5,730
Royalty and commission income 3) 105 93 100
Other operating income 3) 127 98 110
Other operating expenses 3) 6,150 5,567 5,046
EBITDA 3) 1,445 1,199 1,159
Operating profit 3) 4) 5) 1,185 953 894
Net financial result 3) 6) (69) (84) (88)
Income before taxes 3) 4) 6) 1,116 869 806
Income taxes 3) 327 261 238
Net income attributable to non-controlling interests 3) 6) (2) (5) (1)
Net income attributable to shareholders 4) 7) 791 613 567
Income Statement Ratios
Gross margin 3) 47.7% 47.5% 47.8%
Operating margin 3) 4) 5) 8.0% 7.2% 7.5%
Interest coverage 3) 14.6 12.2 10.1
Effective tax rate 3) 4) 29.3% 30.0% 29.5%
Net income attributable to shareholders as a percentage of net sales 4) 7) 5.3% 4.6% 4.7%
Net Sales by Brand (€ in millions)
adidas 11,344 9,867 8,714
Reebok 1,667 1,940 1,913
TaylorMade-adidas Golf 1,344 1,044 909
Rockport 285 261 252
Reebok-CCM Hockey 243 210 200
Net Sales by Product Category (€ in millions)
Footwear 3) 6,922 6,242 5,389
Apparel 3) 6,290 5,733 5,380
Hardware 3) 1,671 1,347 1,221
Balance Sheet Data (€ in millions)
Total assets 6) 11,651 11,237 10,618
Inventories 2,486 2,502 2,119
Receivables and other current assets 2,444 2,431 2,324
Working capital 6) 2,504 1,990 1,972
Net cash/(net borrowings) 448 90 (221)
Shareholders’ equity 6) 5,304 5,137 4,616