Reebok 2012 Annual Report Download - page 173
Download and view the complete annual report
Please find page 173 of the 2012 Reebok annual report below. You can navigate through the pages in the report by either clicking on the pages listed below, or by using the keyword search tool below to find specific information within the annual report.-
 1
1 -
2
-
3
-
4
-
5
-
6
-
7
-
8
-
9
-
10
-
11
-
12
-
13
-
14
-
15
-
16
-
17
-
18
-
19
-
20
-
21
-
22
-
23
-
24
-
25
-
26
-
27
-
28
-
29
-
30
-
31
-
32
-
33
-
34
-
35
-
36
-
37
-
38
-
39
-
40
-
41
-
42
-
43
-
44
-
45
-
46
-
47
-
48
-
49
-
50
-
51
-
52
-
53
-
54
-
55
-
56
-
57
-
58
-
59
-
60
-
61
-
62
-
63
-
64
-
65
-
66
-
67
-
68
-
69
-
70
-
71
-
72
-
73
-
74
-
75
-
76
-
77
-
78
-
79
-
80
-
81
-
82
-
83
-
84
-
85
-
86
-
87
-
88
-
89
-
90
-
91
-
92
-
93
-
94
-
95
-
96
-
97
-
98
-
99
-
100
-
101
-
102
-
103
-
104
-
105
-
106
-
107
-
108
-
109
-
110
-
111
-
112
-
113
-
114
-
115
-
116
-
117
-
118
-
119
-
120
-
121
-
122
-
123
-
124
-
125
-
126
-
127
-
128
-
129
-
130
-
131
-
132
-
133
-
134
-
135
-
136
-
137
-
138
-
139
-
140
-
141
-
142
-
143
-
144
-
145
-
146
-
147
-
148
-
149
-
150
-
151
-
152
-
153
-
154
-
155
-
156
-
157
-
158
-
159
-
160
-
161
-
162
-
 163
163 -
 164
164 -
 165
165 -
 166
166 -
 167
167 -
 168
168 -
 169
169 -
 170
170 -
 171
171 -
 172
172 -
 173
173 -
 174
174 -
 175
175 -
 176
176 -
 177
177 -
 178
178 -
 179
179 -
 180
180 -
 181
181 -
 182
182 -
 183
183 -
184
-
185
-
186
-
187
-
188
-
189
-
190
-
191
-
192
-
193
-
194
-
195
-
196
-
197
-
198
-
199
-
200
-
201
-
202
-
203
-
204
-
205
-
206
-
207
-
208
-
209
-
210
-
211
-
212
-
213
-
214
-
215
-
216
-
217
-
218
-
219
-
220
-
221
-
222
-
223
-
224
-
225
-
226
-
227
-
228
-
229
-
230
-
231
-
232
-
233
-
234
-
235
-
236
-
237
-
238
-
239
-
240
-
241
-
242
-
243
-
244
-
245
-
246
-
247
-
248
-
249
-
250
-
251
-
252
-
253
-
254
-
255
-
256
-
257
-
258
-
259
-
260
-
261
-
262
-
263
-
264
-
265
-
266
-
267
-
268
-
269
-
270
-
271
-
272
-
273
-
274
-
275
-
276
-
277
-
278
-
279
-
280
-
281
-
282
 |
 |
adidas Group
/
2012 Annual Report
Group Management Report – Financial Review
151
2012
/
03.3
/
Business Performance by Segment
/
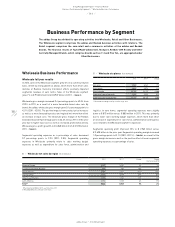
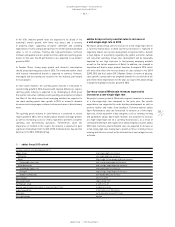
Wholesale Business Performance
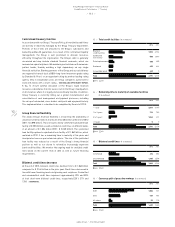
Wholesale development by region
In 2012, currency-neutral sales for the Wholesale segment increased in
all regions except North America. Currency-neutral revenues in Western
Europe rose 1%, driven by double-digit sales growth in the UK and
Poland which more than offset declines in Spain, Switzerland and Italy.
Currency-neutral sales in European Emerging Markets were up 6%,
mainly due to sales increases in Turkey. Currency-neutral Wholesale
sales in North America were down 9% as a result of revenue declines
at Reebok, which more than offset sales growth at adidas. Revenues in
Greater China increased 15% on a currency-neutral basis. Sales in Other
Asian Markets grew 6% on a currency-neutral basis, driven by strong
increases in South Korea and Japan. In Latin America, currency-neutral
sales were up 5%, supported by double-digit sales growth in Argentina,
Chile, Colombia and Peru. Currency translation effects had a mixed
impact on regional sales in euro terms
/
TABLE 02.
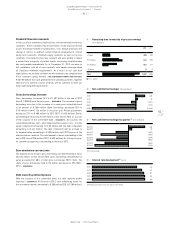
Wholesale development by brand
In 2012, adidas Sport Performance wholesale revenues grew 6% on a
currency-neutral basis. Growth was mainly a result of double-digit sales
increases in the football, running, basketball and outdoor categories.
Currency translation effects had a positive impact on revenues in euro
terms. adidas Sport Performance sales grew 11% to € 6.187 billion from
€ 5.578 billion in the prior year.
04
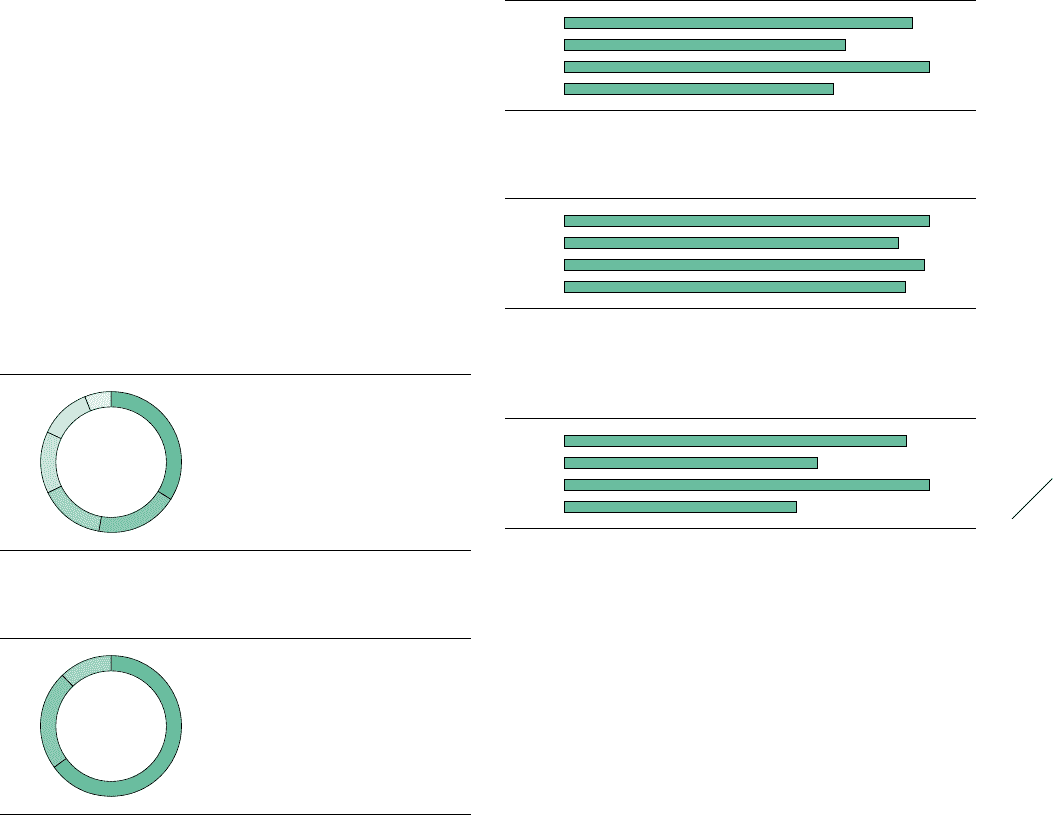
/
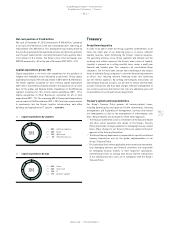
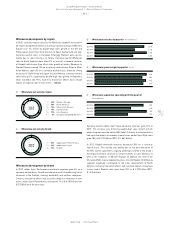
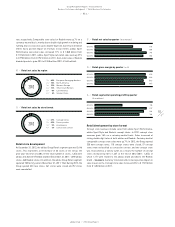
Wholesale net sales by brand
2012 1
/
65% adidas Sport Performance
2
/
23% adidas Sport Style
3
/
12% Reebok
1
2
3
03
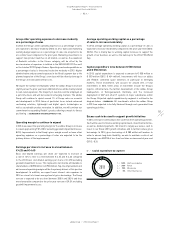
/
Wholesale net sales by region
2012
1
/
34% Western Europe
2
/
18% North America
3
/
16% Other Asian Markets
4
/
14% Greater China
5
/
12% Latin America
6
/
6% European Emerging Markets
6
5
1
2
3
4
05
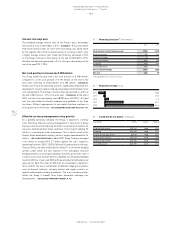
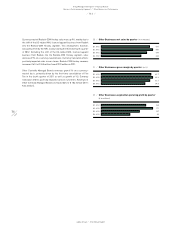
/
Wholesale net sales by quarter (€ in millions)
Q1 2012 2,614
Q2 2012 2,113
Q3 2012 2,743
Q4 2012 2,063
07
/
Wholesale segmental operating profit by quarter
(€ in millions)
Q1 2012 851
Q2 2012 630
Q3 2012 907
Q4 2012 577
06
/
Wholesale gross margin by quarter (in %)
Q1 2012 41.8
Q2 2012 38.3
Q3 2012 41.3
Q4 2012 39.1
Currency-neutral adidas Sport Style wholesale revenues grew 13% in
2012. This increase was driven by double-digit sales growth at both
adidas Originals and the adidas NEO label. Currency translation effects
had a positive impact on revenues in euro terms. adidas Sport Style sales
grew 18% to € 2.193 billion (2011: € 1.861 billion).
In 2012, Reebok wholesale revenues decreased 28% on a currency-
neutral basis. This decline was mainly due to the discontinuation of
the NFL licence agreement, ongoing challenges related to the brand’s
existing joint venture structure in certain markets in Latin America, as
well as the weakness in Western Europe. In addition, the shift of the
US-related NHL licensed apparel business into the Reebok-CCM Hockey
segment negatively contributed to the sales development in North
America. Currency translation effects had a positive impact on revenues
in euro terms. Reebok sales were down 25% to € 1.109 billion (2011:
€ 1.476 billion).