Reebok 2012 Annual Report Download - page 177
Download and view the complete annual report
Please find page 177 of the 2012 Reebok annual report below. You can navigate through the pages in the report by either clicking on the pages listed below, or by using the keyword search tool below to find specific information within the annual report.-
 1
1 -
2
-
3
-
4
-
5
-
6
-
7
-
8
-
9
-
10
-
11
-
12
-
13
-
14
-
15
-
16
-
17
-
18
-
19
-
20
-
21
-
22
-
23
-
24
-
25
-
26
-
27
-
28
-
29
-
30
-
31
-
32
-
33
-
34
-
35
-
36
-
37
-
38
-
39
-
40
-
41
-
42
-
43
-
44
-
45
-
46
-
47
-
48
-
49
-
50
-
51
-
52
-
53
-
54
-
55
-
56
-
57
-
58
-
59
-
60
-
61
-
62
-
63
-
64
-
65
-
66
-
67
-
68
-
69
-
70
-
71
-
72
-
73
-
74
-
75
-
76
-
77
-
78
-
79
-
80
-
81
-
82
-
83
-
84
-
85
-
86
-
87
-
88
-
89
-
90
-
91
-
92
-
93
-
94
-
95
-
96
-
97
-
98
-
99
-
100
-
101
-
102
-
103
-
104
-
105
-
106
-
107
-
108
-
109
-
110
-
111
-
112
-
113
-
114
-
115
-
116
-
117
-
118
-
119
-
120
-
121
-
122
-
123
-
124
-
125
-
126
-
127
-
128
-
129
-
130
-
131
-
132
-
133
-
134
-
135
-
136
-
137
-
138
-
139
-
140
-
141
-
142
-
143
-
144
-
145
-
146
-
147
-
148
-
149
-
150
-
151
-
152
-
153
-
154
-
155
-
156
-
157
-
158
-
159
-
160
-
161
-
162
-
163
-
164
-
165
-
166
-
 167
167 -
 168
168 -
 169
169 -
 170
170 -
 171
171 -
 172
172 -
 173
173 -
 174
174 -
 175
175 -
 176
176 -
 177
177 -
 178
178 -
 179
179 -
 180
180 -
 181
181 -
 182
182 -
 183
183 -
 184
184 -
 185
185 -
 186
186 -
 187
187 -
188
-
189
-
190
-
191
-
192
-
193
-
194
-
195
-
196
-
197
-
198
-
199
-
200
-
201
-
202
-
203
-
204
-
205
-
206
-
207
-
208
-
209
-
210
-
211
-
212
-
213
-
214
-
215
-
216
-
217
-
218
-
219
-
220
-
221
-
222
-
223
-
224
-
225
-
226
-
227
-
228
-
229
-
230
-
231
-
232
-
233
-
234
-
235
-
236
-
237
-
238
-
239
-
240
-
241
-
242
-
243
-
244
-
245
-
246
-
247
-
248
-
249
-
250
-
251
-
252
-
253
-
254
-
255
-
256
-
257
-
258
-
259
-
260
-
261
-
262
-
263
-
264
-
265
-
266
-
267
-
268
-
269
-
270
-
271
-
272
-
273
-
274
-
275
-
276
-
277
-
278
-
279
-
280
-
281
-
282
 |
 |
adidas Group
/
2012 Annual Report
Group Management Report – Financial Review
155
2012
/
03.3
/
Business Performance by Segment
/
Other Businesses Performance
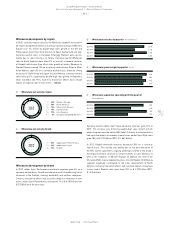
Other Businesses development by region
Currency-neutral sales of Other Businesses increased at a double-
digit rate in all regions. Revenues in Western Europe were up 16% on
a currency-neutral basis due to double-digit sales growth at Other
Centrally Managed Brands and TaylorMade-adidas Golf. Sales at
Reebok-CCM Hockey grew at a low-single-digit rate, and revenues at
Rockport declined at a double-digit rate. Sales in European Emerging
Markets increased 17% on a currency-neutral basis, driven by strong
double-digit growth at Rockport. Revenues at Reebok-CCM Hockey and
TaylorMade-adidas Golf were up at a high-single- and mid-single-digit
rate, respectively. Currency-neutral sales in North America rose 19%,
due to double-digit growth at TaylorMade-adidas Golf and Reebok-CCM
Hockey. Sales at Other Centrally Managed Brands and Rockport
increased at a strong double-digit and low-single-digit rate, respectively.
Revenues in Greater China were up 10% on a currency-neutral basis
as a result of strong growth at TaylorMade-adidas Golf. Sales in Other
Asian Markets grew 12% on a currency-neutral basis, due to double-
digit increases at TaylorMade-adidas Golf, which more than offset a
mid-single-digit decline at Rockport. In Latin America, currency-neutral
sales grew 37%, as a result of strong double-digit growth at TaylorMade-
adidas Golf and Rockport. Currency translation effects had a positive
impact on regional sales in euro terms
/
TABLE 19.
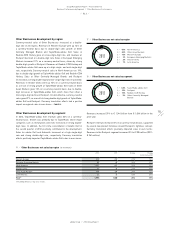
Other Businesses development by segment
In 2012, TaylorMade-adidas Golf revenues grew 20% on a currency-
neutral basis. Growth was primarily due to TaylorMade, where major
categories such as metalwoods and irons increased at strong double-
digit rates. In addition, the first-time consolidation of Adams Golf in
the second quarter of 2012 positively contributed to the development.
Sales for adidas Golf and Ashworth increased at a high-single-digit
rate and strong double-digit rate, respectively. Currency translation
effects positively impacted TaylorMade-adidas Golf sales in euro terms.
Revenues increased 29% to € 1.344 billion from € 1.044 billion in the
prior year.
Rockport revenues increased 2% on a currency-neutral basis, supported
by several new product initiatives around Rockport’s lightness concept.
Currency translation effects positively impacted sales in euro terms.
Revenues in the Rockport segment increased 9% to € 285 million (2011:
€ 261 million).
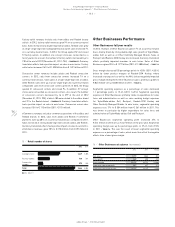
19
/
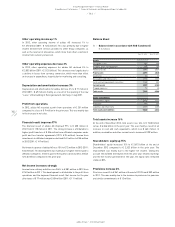
Other Businesses net sales by region (€ in millions)
2012 2011 Change Change
(currency-neutral)
Western Europe 312 259 21% 16%
European Emerging Markets 55 45 22% 17%
North America 1,067 827 29% 19%
Greater China 42 34 21% 10%
Other Asian Markets 478 398 20% 12%
Latin America 22 15 43% 37%
Total 1) 1,977 1,580 25% 17%
1) Rounding differences may arise in totals.
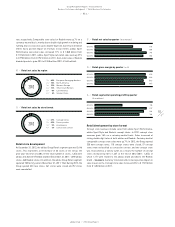
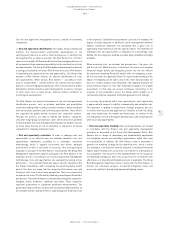
18
/
Other Businesses net sales by segment
1
/
68% TaylorMade-adidas Golf
2
/
15% Rockport
3
/
12% Reebok-CCM Hockey
4
/
5% Other Centrally Managed
Brands
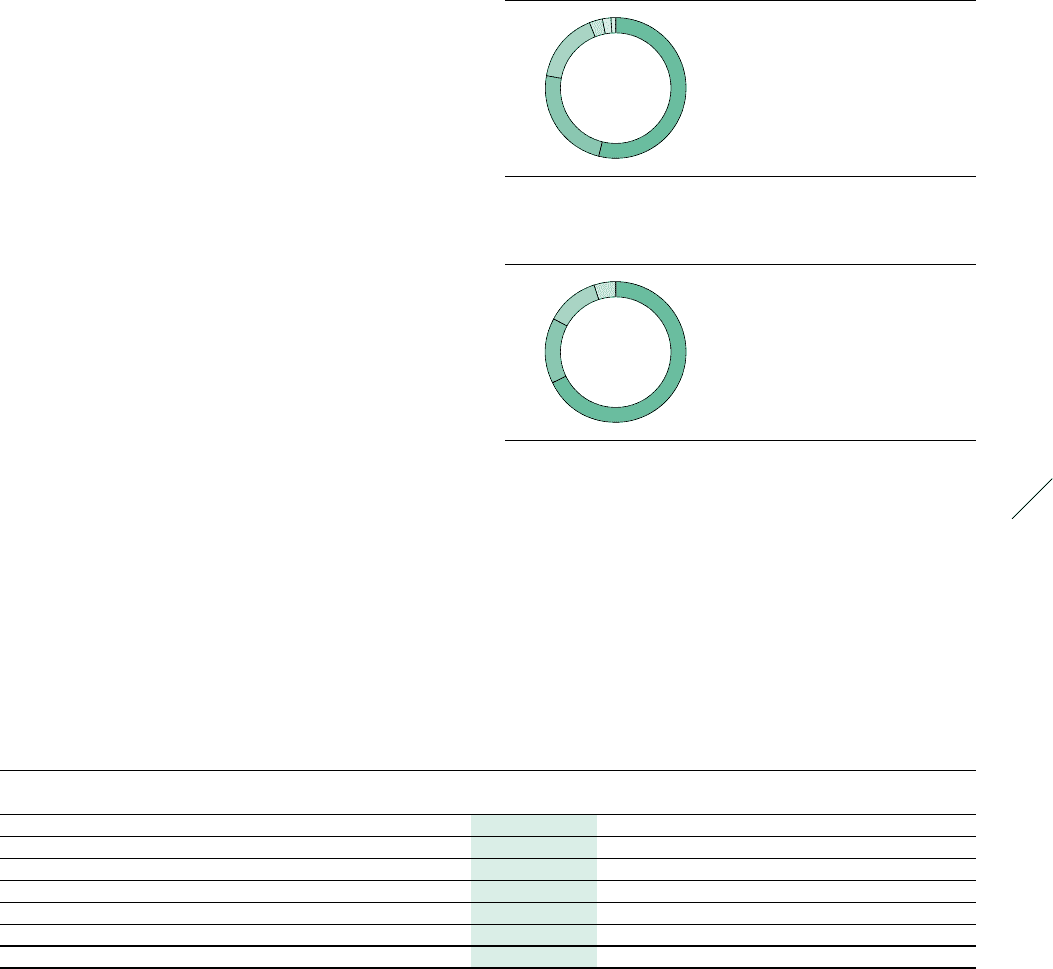
17
/
Other Businesses net sales by region
1
/
54% North America
2
/
24% Other Asian Markets
3
/
16% Western Europe
4
/
3% European Emerging Markets
5
/
2% Greater China
6
/
1% Latin America
2012
1
2
3
2012
6
5
1
2
3
4
4