Reebok 2012 Annual Report Download - page 165
Download and view the complete annual report
Please find page 165 of the 2012 Reebok annual report below. You can navigate through the pages in the report by either clicking on the pages listed below, or by using the keyword search tool below to find specific information within the annual report.-
 1
1 -
2
-
3
-
4
-
5
-
6
-
7
-
8
-
9
-
10
-
11
-
12
-
13
-
14
-
15
-
16
-
17
-
18
-
19
-
20
-
21
-
22
-
23
-
24
-
25
-
26
-
27
-
28
-
29
-
30
-
31
-
32
-
33
-
34
-
35
-
36
-
37
-
38
-
39
-
40
-
41
-
42
-
43
-
44
-
45
-
46
-
47
-
48
-
49
-
50
-
51
-
52
-
53
-
54
-
55
-
56
-
57
-
58
-
59
-
60
-
61
-
62
-
63
-
64
-
65
-
66
-
67
-
68
-
69
-
70
-
71
-
72
-
73
-
74
-
75
-
76
-
77
-
78
-
79
-
80
-
81
-
82
-
83
-
84
-
85
-
86
-
87
-
88
-
89
-
90
-
91
-
92
-
93
-
94
-
95
-
96
-
97
-
98
-
99
-
100
-
101
-
102
-
103
-
104
-
105
-
106
-
107
-
108
-
109
-
110
-
111
-
112
-
113
-
114
-
115
-
116
-
117
-
118
-
119
-
120
-
121
-
122
-
123
-
124
-
125
-
126
-
127
-
128
-
129
-
130
-
131
-
132
-
133
-
134
-
135
-
136
-
137
-
138
-
139
-
140
-
141
-
142
-
143
-
144
-
145
-
146
-
147
-
148
-
149
-
150
-
151
-
152
-
153
-
154
-
 155
155 -
 156
156 -
 157
157 -
 158
158 -
 159
159 -
 160
160 -
 161
161 -
 162
162 -
 163
163 -
 164
164 -
 165
165 -
 166
166 -
 167
167 -
 168
168 -
 169
169 -
 170
170 -
 171
171 -
 172
172 -
 173
173 -
 174
174 -
 175
175 -
176
-
177
-
178
-
179
-
180
-
181
-
182
-
183
-
184
-
185
-
186
-
187
-
188
-
189
-
190
-
191
-
192
-
193
-
194
-
195
-
196
-
197
-
198
-
199
-
200
-
201
-
202
-
203
-
204
-
205
-
206
-
207
-
208
-
209
-
210
-
211
-
212
-
213
-
214
-
215
-
216
-
217
-
218
-
219
-
220
-
221
-
222
-
223
-
224
-
225
-
226
-
227
-
228
-
229
-
230
-
231
-
232
-
233
-
234
-
235
-
236
-
237
-
238
-
239
-
240
-
241
-
242
-
243
-
244
-
245
-
246
-
247
-
248
-
249
-
250
-
251
-
252
-
253
-
254
-
255
-
256
-
257
-
258
-
259
-
260
-
261
-
262
-
263
-
264
-
265
-
266
-
267
-
268
-
269
-
270
-
271
-
272
-
273
-
274
-
275
-
276
-
277
-
278
-
279
-
280
-
281
-
282
 |
 |
adidas Group
/
2012 Annual Report
Group Management Report – Financial Review
143
2012
/
03.2
/
Group Business Performance
/
Treasur y
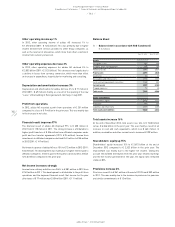
48
/
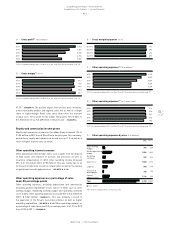
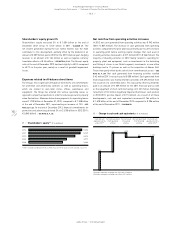
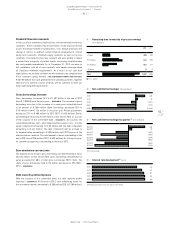
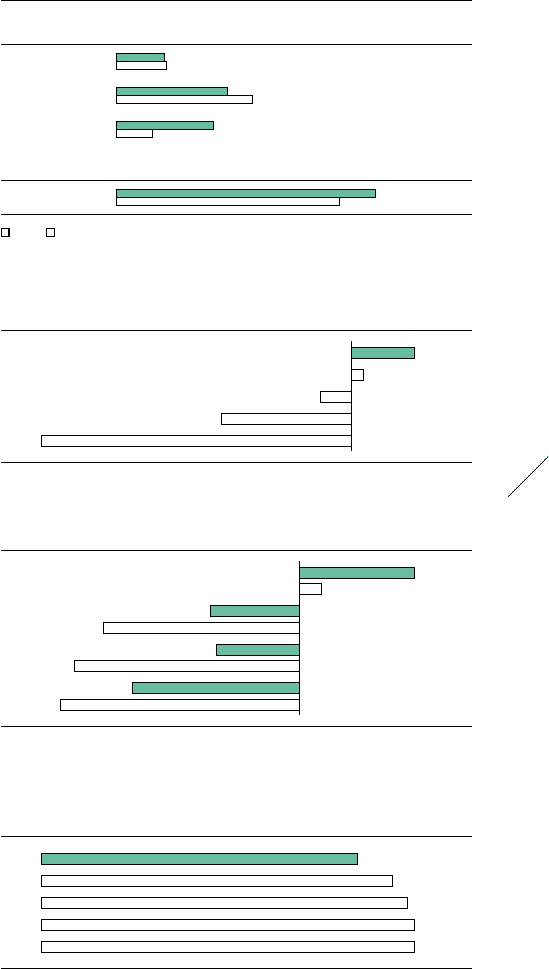
Net cash/(net borrowings) (€ in millions)
2012 448
2011 90
2010 (221)
2009 (917)
2008 (2,189)
50
/
Interest rate development 1) (in %)
2012 4.4
2011 4.9
2010 5.1
2009 5.2
2008 5.2
1) Weighted average interest rate of gross borrowings.
49
/
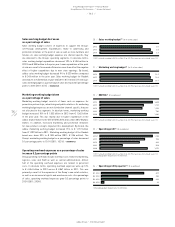
Net cash/(net borrowings) by quarter 1) (€ in millions)
Q4 2012 448
Q4 2011 90
Q3 2012 (337)
Q3 2011 (750)
Q2 2012 (318)
Q2 2011 (863)
Q1 2012 (640)
Q1 2011 (914)
1) At end of period.
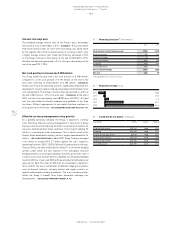
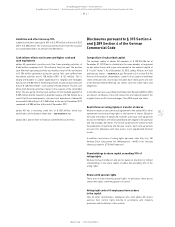
47
/
Remaining time to maturity of gross borrowings
(€ in millions)
2012 2011
< 1 year 280 289
1 to 3 years 644 780
3 to 5 years 563 211
> 5 years 00
Total 1,487 1,280
■ 2012 ■ 2011
Standard financial covenants
In the case of our committed credit facilities, we have entered into various
covenants. These covenants may include limits on the disposal of fixed
assets, the amount of debt secured by liens, cross default provisions and
change of control. In addition, certain financial arrangements contain
equity ratio covenants, minimum equity covenants as well as net loss
covenants. If we failed to meet any covenant and were unable to obtain
a waiver from a majority of partner banks, borrowings would become
due and payable immediately. As at December 31, 2012, we were in
full compliance with all of our covenants, with ample coverage above
all stipulated minimum requirements. As a result of our cash flow
expectations, we are fully confident we will continue to be compliant with
these covenants going forward
/
SEE SUBSEQUENT EVENTS AND OUTLOOK,
P. 157. We believe that cash generated from operating activities, together
with access to external sources of funds, will be sufficient to meet our
future operating and capital needs.
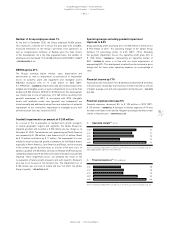
Gross borrowings increase
Gross borrowings increased 16% to € 1.487 billion at the end of 2012
from € 1.280 billion in the prior year
/
DIAGRAM 46. The increase in gross
borrowings was due to the issuance of a seven-year convertible bond
in an amount of € 500 million. Bank borrowings decreased 53% to
€ 59 million from € 126 million in the prior year. Private placements
decreased 27% to € 480 million in 2012 (2011: € 655 million). Bonds
outstanding increased by € 449 million at the end of 2012 as a result
of the issuance of the convertible bond
/
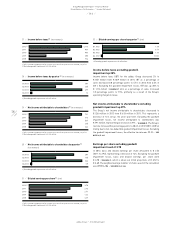
DIAGRAM 51. At issuance, the
convertible bond was split – after deducting the issuance costs – into the
equity component amounting to € 55 million and the debt component
amounting to € 441 million. The debt component will be accrued to
its nominal value amounting to € 500 million until 2017 by use of the
effective interest method. The total amount of bonds outstanding at the
end of 2012 was € 948 million (2011: € 499 million). As in the prior year,
no commercial paper was outstanding at the end of 2012.
Euro dominates currency mix
The majority of our Group’s gross borrowings are denominated in euros
and US dollars. At the end of 2012, gross borrowings denominated in
euros accounted for 68% of total gross borrowings (2011: 56%). The
share of gross borrowings held in US dollars decreased to 29% (2011:
35%)
/
DIAGRAM 46.
Debt maturity profile improves
With the issuance of the convertible bond, our debt maturity profile
improved
/
DIAGRAM 47. At the end of 2012, total refinancing needs for
the next twelve months amounted to € 280 million (2011: € 289 million).