Reebok 2012 Annual Report Download - page 260
Download and view the complete annual report
Please find page 260 of the 2012 Reebok annual report below. You can navigate through the pages in the report by either clicking on the pages listed below, or by using the keyword search tool below to find specific information within the annual report.-
 1
1 -
2
-
3
-
4
-
5
-
6
-
7
-
8
-
9
-
10
-
11
-
12
-
13
-
14
-
15
-
16
-
17
-
18
-
19
-
20
-
21
-
22
-
23
-
24
-
25
-
26
-
27
-
28
-
29
-
30
-
31
-
32
-
33
-
34
-
35
-
36
-
37
-
38
-
39
-
40
-
41
-
42
-
43
-
44
-
45
-
46
-
47
-
48
-
49
-
50
-
51
-
52
-
53
-
54
-
55
-
56
-
57
-
58
-
59
-
60
-
61
-
62
-
63
-
64
-
65
-
66
-
67
-
68
-
69
-
70
-
71
-
72
-
73
-
74
-
75
-
76
-
77
-
78
-
79
-
80
-
81
-
82
-
83
-
84
-
85
-
86
-
87
-
88
-
89
-
90
-
91
-
92
-
93
-
94
-
95
-
96
-
97
-
98
-
99
-
100
-
101
-
102
-
103
-
104
-
105
-
106
-
107
-
108
-
109
-
110
-
111
-
112
-
113
-
114
-
115
-
116
-
117
-
118
-
119
-
120
-
121
-
122
-
123
-
124
-
125
-
126
-
127
-
128
-
129
-
130
-
131
-
132
-
133
-
134
-
135
-
136
-
137
-
138
-
139
-
140
-
141
-
142
-
143
-
144
-
145
-
146
-
147
-
148
-
149
-
150
-
151
-
152
-
153
-
154
-
155
-
156
-
157
-
158
-
159
-
160
-
161
-
162
-
163
-
164
-
165
-
166
-
167
-
168
-
169
-
170
-
171
-
172
-
173
-
174
-
175
-
176
-
177
-
178
-
179
-
180
-
181
-
182
-
183
-
184
-
185
-
186
-
187
-
188
-
189
-
190
-
191
-
192
-
193
-
194
-
195
-
196
-
197
-
198
-
199
-
200
-
201
-
202
-
203
-
204
-
205
-
206
-
207
-
208
-
209
-
210
-
211
-
212
-
213
-
214
-
215
-
216
-
217
-
218
-
219
-
220
-
221
-
222
-
223
-
224
-
225
-
226
-
227
-
228
-
229
-
230
-
231
-
232
-
233
-
234
-
235
-
236
-
237
-
238
-
239
-
240
-
241
-
242
-
243
-
244
-
245
-
246
-
247
-
248
-
249
-
 250
250 -
 251
251 -
 252
252 -
 253
253 -
 254
254 -
 255
255 -
 256
256 -
 257
257 -
 258
258 -
 259
259 -
 260
260 -
 261
261 -
 262
262 -
 263
263 -
 264
264 -
 265
265 -
 266
266 -
 267
267 -
 268
268 -
 269
269 -
 270
270 -
271
-
272
-
273
-
274
-
275
-
276
-
277
-
278
-
279
-
280
-
281
-
282
 |
 |

9
adidas Group
/
2012 Annual Report
Consolidated Financial Statements
238
2012
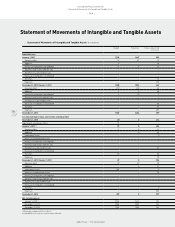
Statement of Movements of Intangible and Tangible Assets
/
04.9
/
Statement of Movements of Intangible and Tangible Assets
..
/
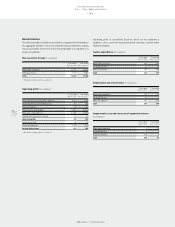
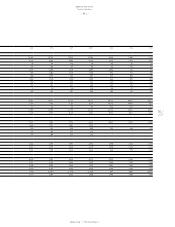
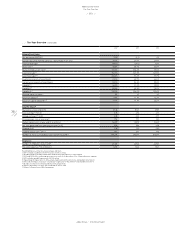
Statement of Movements of Intangible and Tangible Assets (€ in millions)
Goodwill Trademarks Software, patents and
concessions
Acquisition cost
January 1, 2011 1,539 1,447 595
Currency effect 31 47 12
Additions 0 – 58
Increase in companies consolidated 11 8 15
Transfers from assets held for sale – – –
Transfers to assets held for sale – – –
Decrease in companies consolidated – – –
Transfers – – (1)
Disposals – – (17)
December 31, 2011/January 1, 2012 1,580 1,503 662
Currency effect (17) (29) (8)
Additions 0 0 58
Increase in companies consolidated 6 10 3
Transfers from assets held for sale – – –
Transfers to assets held for sale – – –
Decrease in companies consolidated – – (0)
Transfers – – (1)
Disposals – – (25)
December 31, 2012 1,569 1,484 689
Accumulated depreciation, amortisation and impairment
December 31, 2010 (0) 0 456
Adjustments according to IAS 8 27 – –
January 1, 2011 1) 27 0 456
Currency effect 1 0 11
Additions – 0 46
Impairment losses – – 0
Reversals of impairment losses – – –
Increase in companies consolidated – – –
Transfers from assets held for sale – – –
Transfers to assets held for sale – – (0)
Decrease in companies consolidated – – –
Transfers (0) – (0)
Disposals – – (7)
December 31, 2011/January 1, 2012 27 0 506
Currency effect (6) (0) (7)
Additions – 0 47
Impairment losses 265 – 0
Reversals of impairment losses – – (0)
Increase in companies consolidated – – –
Transfers from assets held for sale – – –
Transfers to assets held for sale – – –
Decrease in companies consolidated – – –
Transfers – – 0
Disposals – – (20)
December 31, 2012 287 0 527
Net carrying amount
January 1, 2011 1) 1,512 1,447 139
December 31, 2011 1,553 1,503 156
December 31, 2012 1,281 1,484 162
1) Restated according to IAS 8, see Note 03.
Rounding differences may arise in percentages and totals.