Reebok 2012 Annual Report Download - page 151
Download and view the complete annual report
Please find page 151 of the 2012 Reebok annual report below. You can navigate through the pages in the report by either clicking on the pages listed below, or by using the keyword search tool below to find specific information within the annual report.-
 1
1 -
2
-
3
-
4
-
5
-
6
-
7
-
8
-
9
-
10
-
11
-
12
-
13
-
14
-
15
-
16
-
17
-
18
-
19
-
20
-
21
-
22
-
23
-
24
-
25
-
26
-
27
-
28
-
29
-
30
-
31
-
32
-
33
-
34
-
35
-
36
-
37
-
38
-
39
-
40
-
41
-
42
-
43
-
44
-
45
-
46
-
47
-
48
-
49
-
50
-
51
-
52
-
53
-
54
-
55
-
56
-
57
-
58
-
59
-
60
-
61
-
62
-
63
-
64
-
65
-
66
-
67
-
68
-
69
-
70
-
71
-
72
-
73
-
74
-
75
-
76
-
77
-
78
-
79
-
80
-
81
-
82
-
83
-
84
-
85
-
86
-
87
-
88
-
89
-
90
-
91
-
92
-
93
-
94
-
95
-
96
-
97
-
98
-
99
-
100
-
101
-
102
-
103
-
104
-
105
-
106
-
107
-
108
-
109
-
110
-
111
-
112
-
113
-
114
-
115
-
116
-
117
-
118
-
119
-
120
-
121
-
122
-
123
-
124
-
125
-
126
-
127
-
128
-
129
-
130
-
131
-
132
-
133
-
134
-
135
-
136
-
137
-
138
-
139
-
140
-
 141
141 -
 142
142 -
 143
143 -
 144
144 -
 145
145 -
 146
146 -
 147
147 -
 148
148 -
 149
149 -
 150
150 -
 151
151 -
 152
152 -
 153
153 -
 154
154 -
 155
155 -
 156
156 -
 157
157 -
 158
158 -
 159
159 -
 160
160 -
 161
161 -
162
-
163
-
164
-
165
-
166
-
167
-
168
-
169
-
170
-
171
-
172
-
173
-
174
-
175
-
176
-
177
-
178
-
179
-
180
-
181
-
182
-
183
-
184
-
185
-
186
-
187
-
188
-
189
-
190
-
191
-
192
-
193
-
194
-
195
-
196
-
197
-
198
-
199
-
200
-
201
-
202
-
203
-
204
-
205
-
206
-
207
-
208
-
209
-
210
-
211
-
212
-
213
-
214
-
215
-
216
-
217
-
218
-
219
-
220
-
221
-
222
-
223
-
224
-
225
-
226
-
227
-
228
-
229
-
230
-
231
-
232
-
233
-
234
-
235
-
236
-
237
-
238
-
239
-
240
-
241
-
242
-
243
-
244
-
245
-
246
-
247
-
248
-
249
-
250
-
251
-
252
-
253
-
254
-
255
-
256
-
257
-
258
-
259
-
260
-
261
-
262
-
263
-
264
-
265
-
266
-
267
-
268
-
269
-
270
-
271
-
272
-
273
-
274
-
275
-
276
-
277
-
278
-
279
-
280
-
281
-
282
 |
 |

adidas Group
/
2012 Annual Report
Group Management Report – Financial Review
129
2012
/
03.2
/
Group Business Performance
/
Economic and Sector Development
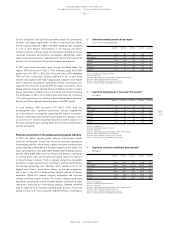
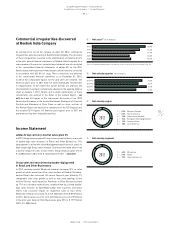
02
/
Quarterly unemployment rate by region
(in % of total active population)
Q4 2011 Q1 2012 Q2 2012 Q3 2012 Q4 2012
USA 1) 8.7 8.2 8.2 8.0 7.8
Euro area 2) 10.7 11.0 11.4 11.6 11.7
Japan 3) 4.5 4.5 4.3 4.2 4.2
China 4) 4.1 4.1 4.1 4.1 4.1
Russia 5) 6.1 6.5 5.4 5.2 5.3
Brazil 6) 4.7 6.2 5.9 5.4 4.6
1) Source: US Bureau of Labor Statistics.
2) Source: Eurostat.
3) Source: Japan Ministry of Internal Affairs and Communications.
4) Source: China National Bureau of Statistics.
5) Source: Russia Federal Service of State Statistics.
6) Source: Brazil Institute of Geography and Statistics.
03
/
Quarterly development of Consumer Price Index 1)
(by region)
Q4 2011 Q1 2012 Q2 2012 Q3 2012 Q4 2012
USA 2) 3.0 2.7 1.7 2.0 1.7
Euro area 3) 2.7 2.7 2.4 2.6 2.2
Japan 4) (0.2) 0.5 (0.2) (0.3) (0.1)
China 5) 4.1 3.6 2.2 1.9 2.5
Russia 6) 6.1 3.7 4.3 6.6 6.6
Brazil 7) 6.5 5.2 4.9 5.3 5.8
1) Quarter-end figures.
2) Source: US Bureau of Labor Statistics.
3) Source: Eurostat.
4) Source: Japan Ministry of Internal Affairs and Communications.
5) Source: China National Bureau of Statistics.
6) Source: Russia Federal Service of State Statistics.
7) Source: Brazil Institute of Geography and Statistics.
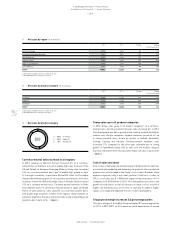
04
/
Quarterly consumer confidence development 1)
(by region)
Q4 2011 Q1 2012 Q2 2012 Q3 2012 Q4 2012
USA 2) 64.8 69.5 62.7 68.4 66.7
Euro area 3) (21.2) (18.9) (19.6) (25.7) (26.3)
Japan 4) 38.1 40.1 40.8 40.4 39.1
China 5) 100.5 100.0 99.3 100.8 103.7
Russia 6) (7.0) (5.0) (4.0) (6.0) (8.0)
Brazil 7) 113.4 113.2 112.6 113.2 115.2
1) Quarter-end figures.
2) Source: US Bureau of Labor Statistics.
3) Source: Eurostat.
4) Source: Japan Ministry of Internal Affairs and Communications.
5) Source: China National Bureau of Statistics.
6) Source: Russia Federal Service of State Statistics.
7) Source: Brazil Institute of Geography and Statistics.
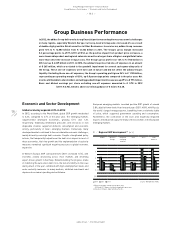
Despite disruptions from political uncertainty around the presidential
elections and budget negotiations, as well as from hurricane Sandy,
the US economy improved in 2012, with GDP expanding 1.8% compared
to 1.7% in 2011. Modest improvements in the housing and labour
markets as well as relatively stable food and fuel prices helped increase
consumer confidence and domestic consumption. Additionally, robust
export and industrial activity, supported by increasing trade with Asian
markets, also contributed to the positive economic development.
In 2012, most Asian economies grew strongly. Excluding Japan, the
region’s GDP increased 6.1% (2011: 7.4%). Including Japan, Asian GDP
growth was 4.4% (2011: 4.0%), with China and India’s GDP expanding
7.8% and 5.3%, respectively. Inflation stabilised or fell in most Asian
markets and, together with robust wage growth, helped to drive higher
levels of domestic consumption, particularly in China. These factors also
supported an increase in trade between the region’s economies, which
helped offset the reduced demand from most mature markets. In Japan,
despite government stimulus and reconstruction investments following
the earthquake in 2011, the economy grew only modestly, increasing
1.9%, with high energy costs, lacklustre global demand and a diplomatic
dispute with China negatively impacting exports and GDP growth.
In Latin America, GDP increased 2.7% (2011: 4.2%), with low
unemployment rates, significant government stimulus programmes
and solid domestic consumption supporting the region’s economies.
However, moderating export demand, particularly from Europe, as well
as an increase in inflation negatively impacted economic expansion of
the region during the year, making 2012 one of the lowest growth years
over the last decade.
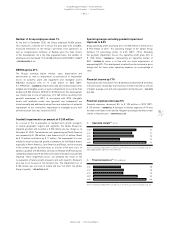
Positive momentum in the global sporting goods industry
In 2012, the global sporting goods industry outperformed overall
economic development. Growth was driven by consumer spending in
the emerging markets, which offset subdued consumer confidence and
private spending in many Western European markets and in Japan. Two
major sporting events, the London 2012 Olympic and Paralympic Games
and the UEFA EURO 2012 hosted by Poland and Ukraine, contributed
to sporting goods sales and in particular helped support the industry
in many European markets. From a category perspective, basketball
posted the strongest growth rate in the industry, with both performance
and lifestyle performing well. Running, which remained one of the
biggest sales drivers, faced some softness as the year progressed,
due in part to the shift in demand from lifestyle running to lifestyle
basketball. Within the running category, lightweight and technical
running continued to grow robustly. The outdoor category faced some
headwinds, primarily due to unseasonable weather, resulting in a slight
contraction, especially for snow-related products. Demand remained
high for higher-priced, innovative sporting goods products introduced
during the year with many advanced, high-performance technologies