Reebok 2012 Annual Report Download - page 183
Download and view the complete annual report
Please find page 183 of the 2012 Reebok annual report below. You can navigate through the pages in the report by either clicking on the pages listed below, or by using the keyword search tool below to find specific information within the annual report.-
 1
1 -
2
-
3
-
4
-
5
-
6
-
7
-
8
-
9
-
10
-
11
-
12
-
13
-
14
-
15
-
16
-
17
-
18
-
19
-
20
-
21
-
22
-
23
-
24
-
25
-
26
-
27
-
28
-
29
-
30
-
31
-
32
-
33
-
34
-
35
-
36
-
37
-
38
-
39
-
40
-
41
-
42
-
43
-
44
-
45
-
46
-
47
-
48
-
49
-
50
-
51
-
52
-
53
-
54
-
55
-
56
-
57
-
58
-
59
-
60
-
61
-
62
-
63
-
64
-
65
-
66
-
67
-
68
-
69
-
70
-
71
-
72
-
73
-
74
-
75
-
76
-
77
-
78
-
79
-
80
-
81
-
82
-
83
-
84
-
85
-
86
-
87
-
88
-
89
-
90
-
91
-
92
-
93
-
94
-
95
-
96
-
97
-
98
-
99
-
100
-
101
-
102
-
103
-
104
-
105
-
106
-
107
-
108
-
109
-
110
-
111
-
112
-
113
-
114
-
115
-
116
-
117
-
118
-
119
-
120
-
121
-
122
-
123
-
124
-
125
-
126
-
127
-
128
-
129
-
130
-
131
-
132
-
133
-
134
-
135
-
136
-
137
-
138
-
139
-
140
-
141
-
142
-
143
-
144
-
145
-
146
-
147
-
148
-
149
-
150
-
151
-
152
-
153
-
154
-
155
-
156
-
157
-
158
-
159
-
160
-
161
-
162
-
163
-
164
-
165
-
166
-
167
-
168
-
169
-
170
-
171
-
172
-
 173
173 -
 174
174 -
 175
175 -
 176
176 -
 177
177 -
 178
178 -
 179
179 -
 180
180 -
 181
181 -
 182
182 -
 183
183 -
 184
184 -
 185
185 -
 186
186 -
 187
187 -
 188
188 -
 189
189 -
 190
190 -
 191
191 -
 192
192 -
 193
193 -
194
-
195
-
196
-
197
-
198
-
199
-
200
-
201
-
202
-
203
-
204
-
205
-
206
-
207
-
208
-
209
-
210
-
211
-
212
-
213
-
214
-
215
-
216
-
217
-
218
-
219
-
220
-
221
-
222
-
223
-
224
-
225
-
226
-
227
-
228
-
229
-
230
-
231
-
232
-
233
-
234
-
235
-
236
-
237
-
238
-
239
-
240
-
241
-
242
-
243
-
244
-
245
-
246
-
247
-
248
-
249
-
250
-
251
-
252
-
253
-
254
-
255
-
256
-
257
-
258
-
259
-
260
-
261
-
262
-
263
-
264
-
265
-
266
-
267
-
268
-
269
-
270
-
271
-
272
-
273
-
274
-
275
-
276
-
277
-
278
-
279
-
280
-
281
-
282
 |
 |
adidas Group
/
2012 Annual Report
Group Management Report – Financial Review
161
2012
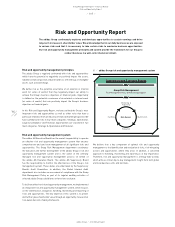
Subsequent Events and Outlook
/
03.4
/
Average operating working capital as a percentage
of sales to increase moderately
In 2013, average operating working capital as a percentage of sales is
expected to increase moderately compared to the prior year level (2012:
20.0%). This is mainly due to working capital increases to support the
growth of our business as well as the build-up to the 2014 FIFA World
Cup.
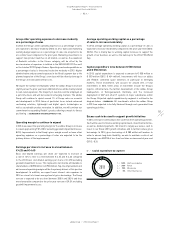
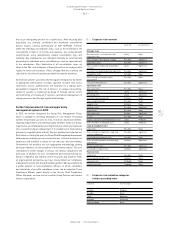
Capital expenditure to be between € 500 million
and € 550 million
In 2013, capital expenditure is expected to amount to € 500 million to
€ 550 million (2012: € 434 million). Investments will focus on adidas
and Reebok controlled space initiatives, in particular in emerging
markets. These investments will account for around 35% of total
investments in 2013. Other areas of investment include the Group’s
logistics infrastructure, the further development of the adidas Group
headquarters in Herzogenaurach, Germany, and the increased
deployment of SAP and other IT systems in major subsidiaries within
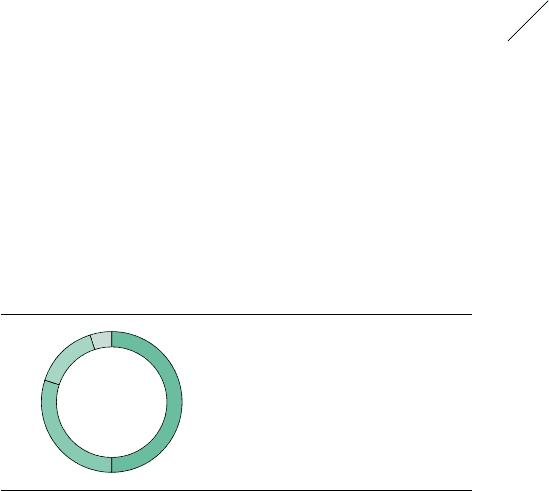
the Group. Projected capital expenditure by segment is outlined in the
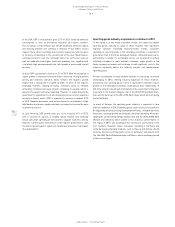
diagram below
/
DIAGRAM 02. All investments within the adidas Group
in 2013 are expected to be fully financed through cash generated from
operating activities.
Excess cash to be used to support growth initiatives
In 2013, we expect continued positive cash flow from operating activities.
Cash will be used to finance working capital needs, investment activities,
as well as dividend payments. We intend to largely use excess cash to
invest in our Route 2015 growth initiatives and to further reduce gross
borrowings. In 2013, gross borrowings of € 280 million will mature. In
order to ensure long-term flexibility, we aim to maintain a ratio of net
borrowings over EBITDA of less than two times as measured at year-end
(2012: –0.3).
Group other operating expenses to decrease modestly
as a percentage of sales
In 2013, the Group’s other operating expenses as a percentage of sales
are expected to decrease modestly (2012: 41.3%). Sales and marketing
working budget expenses as a percentage of sales are projected to be
at a similar level compared to the prior year. Marketing investments to
support new product launches at all brands, as well as the expansion
of Reebok’s activities in the fitness category, will be offset by the
non-recurrence of expenses in relation to the UEFA EURO 2012 as well
as the London 2012 Olympic Games. Operating overhead expenditure as
a percentage of sales is forecasted to decline modestly in 2013. Higher
administrative and personnel expenses in the Retail segment due to the
planned expansion of the Group’s store base will be offset by leverage in
the Group’s non-allocated central costs.
We expect the number of employees within the adidas Group to increase
slightly versus the prior year level. Additional hires will be mainly related
to own-retail expansion. The majority of new hires will be employed on
a part-time basis and will be located in emerging markets. The adidas
Group will continue to spend around 1% of Group sales on research
and development in 2013. Areas of particular focus include advanced
cushioning solutions, lightweight and digital sports technologies as
well as sustainable product innovation. In addition, we will continue our
commitment to expanding Reebok’s product offering to match its fitness
positioning
/
SEE RESEARCH AND DEVELOPMENT, P. 105.
Operating margin to continue to expand
In 2013, we expect the operating margin for the adidas Group to increase
to a level approaching 9.0% (2012 excluding goodwill impairment losses:
8.0%). Improvements in the Group’s gross margin as well as lower other
operating expenses as a percentage of sales are expected to be the
primary drivers of the improvement.
Earnings per share to increase to a level between
€ 4.25 and € 4.40
Basic and diluted earnings per share are expected to increase at
a rate of 12% to 16% to a level between € 4.25 and € 4.40 compared
to the 2012 basic and diluted earnings per share of € 3.78 excluding
goodwill impairment losses. This represents net income attributable to
shareholders of € 890 million to € 920 million. Top-line improvement and
an increased operating margin will be the primary drivers of this positive
development. In addition, we expect lower interest rate expenses in
2013 as a result of a lower average level of gross borrowings. The Group
tax rate is expected to be at a level between 28.0% and 28.5% and thus
more favourable compared to the prior year tax rate of 29.3% excluding
goodwill impairment losses.
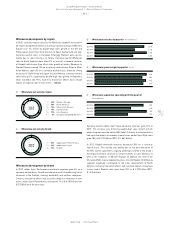
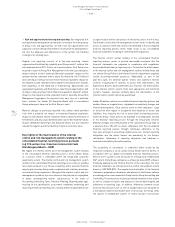
02
/
Capital expenditure by segment
2013
1
/
50% HQ/Consolidation
2
/
30% Retail
3
/
15% Wholesale
4
/
5% Other Businesses
1
2
3 4