Reebok 2012 Annual Report Download - page 58
Download and view the complete annual report
Please find page 58 of the 2012 Reebok annual report below. You can navigate through the pages in the report by either clicking on the pages listed below, or by using the keyword search tool below to find specific information within the annual report.-
 1
1 -
2
-
3
-
4
-
5
-
6
-
7
-
8
-
9
-
10
-
11
-
12
-
13
-
14
-
15
-
16
-
17
-
18
-
19
-
20
-
21
-
22
-
23
-
24
-
25
-
26
-
27
-
28
-
29
-
30
-
31
-
32
-
33
-
34
-
35
-
36
-
37
-
38
-
39
-
40
-
41
-
42
-
43
-
44
-
45
-
46
-
47
-
 48
48 -
 49
49 -
 50
50 -
 51
51 -
 52
52 -
 53
53 -
 54
54 -
 55
55 -
 56
56 -
 57
57 -
 58
58 -
 59
59 -
 60
60 -
 61
61 -
 62
62 -
 63
63 -
 64
64 -
 65
65 -
 66
66 -
 67
67 -
 68
68 -
69
-
70
-
71
-
72
-
73
-
74
-
75
-
76
-
77
-
78
-
79
-
80
-
81
-
82
-
83
-
84
-
85
-
86
-
87
-
88
-
89
-
90
-
91
-
92
-
93
-
94
-
95
-
96
-
97
-
98
-
99
-
100
-
101
-
102
-
103
-
104
-
105
-
106
-
107
-
108
-
109
-
110
-
111
-
112
-
113
-
114
-
115
-
116
-
117
-
118
-
119
-
120
-
121
-
122
-
123
-
124
-
125
-
126
-
127
-
128
-
129
-
130
-
131
-
132
-
133
-
134
-
135
-
136
-
137
-
138
-
139
-
140
-
141
-
142
-
143
-
144
-
145
-
146
-
147
-
148
-
149
-
150
-
151
-
152
-
153
-
154
-
155
-
156
-
157
-
158
-
159
-
160
-
161
-
162
-
163
-
164
-
165
-
166
-
167
-
168
-
169
-
170
-
171
-
172
-
173
-
174
-
175
-
176
-
177
-
178
-
179
-
180
-
181
-
182
-
183
-
184
-
185
-
186
-
187
-
188
-
189
-
190
-
191
-
192
-
193
-
194
-
195
-
196
-
197
-
198
-
199
-
200
-
201
-
202
-
203
-
204
-
205
-
206
-
207
-
208
-
209
-
210
-
211
-
212
-
213
-
214
-
215
-
216
-
217
-
218
-
219
-
220
-
221
-
222
-
223
-
224
-
225
-
226
-
227
-
228
-
229
-
230
-
231
-
232
-
233
-
234
-
235
-
236
-
237
-
238
-
239
-
240
-
241
-
242
-
243
-
244
-
245
-
246
-
247
-
248
-
249
-
250
-
251
-
252
-
253
-
254
-
255
-
256
-
257
-
258
-
259
-
260
-
261
-
262
-
263
-
264
-
265
-
266
-
267
-
268
-
269
-
270
-
271
-
272
-
273
-
274
-
275
-
276
-
277
-
278
-
279
-
280
-
281
-
282
 |
 |

adidas Group
/
2012 Annual Report
To Our Shareholders
36
2012
/
01.2
/
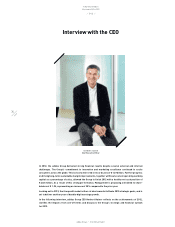
Interview with the CEO
You also had goodwill impairment losses in 2012. Could you
please elaborate on what the reasons for this were? Does this
have any impact on your future outlook?
/
First of all, let me point out that impairment losses are non-cash
in nature and do not affect the adidas Group’s financial situation, nor
our future outlook. Taking into account our updated targets for Route
2015, outlined in September, and following our review of medium-term
growth prospects for specific markets and segments, as part of the
annual impairment test, we came to the conclusion that a few of our
cash-generating units need to be impaired. The resulting impairment
of € 265 million means we have reduced goodwill on our balance sheet
by 17% to € 1.3 billion. In the overall scheme of things, from a balance
sheet perspective, the negative impact on total assets is minor, at
only 2%. Looking at the specifics, within wholesale cash-generating
units, goodwill impairment losses amounted to € 106 million in North
America, € 41 million in Latin America, € 15 million in Brazil and
€ 11 million in Iberia. The impairment losses were mainly caused by
adjusted growth assumptions for the Reebok brand, especially in North
America, Latin America and Brazil, and an increase in the country-
specific discount rates as a result of the euro crisis. In addition, goodwill
of € 68 million allocated to Reebok-CCM Hockey and € 24 million
allocated to Rockport was impaired. These impairment losses are the
result of the re-evaluation of future growth prospects and, with regard
to Rockport, also due to an increase in the discount rate. Again, we have
provided full transparency and clarity on this topic in Note 2 of our 2012
Annual Report.
2012 was another year of significant cash generation. What are
your plans in terms of capital deployment?
/
Through our continuous focus on cash flow generation, we have
increased our net cash to € 448 million. Our cash flow from operating
activities was up 17%. This once again demonstrates the strength of our
business model and puts us in a superb position to support and invest
in the opportunities and growth initiatives of our Route 2015 strategic
business plan. Executing on this will ultimately yield superior returns
to our shareholders. Therefore, I do not see any reason to change
our approach right now. We will continue to pay down our maturing
gross borrowings, which will amount to € 280 million in 2013. And
we will increase our capital expenditure to between € 500 million and
€ 550 million to further support Group-wide initiatives in areas such as
own retail, infrastructure and IT. However, at the same time, we will also
continue to advance direct shareholder returns, and the annual dividend
is currently our focus tool for this. For 2012, we intend to pay a dividend
per share of € 1.35, which is 35% more than in 2011. This represents a
payout ratio excluding goodwill impairment losses of 35.7%, compared
to 34.1% last year.
Although the fourth quarter is a small contributor to your
annual results, is there anything we should be concerned
about with weaker trends in the period?
/
No, definitely not. I highlighted in November that there would
be a few negative factors to consider in the fourth quarter. Firstly, our
European business faced the anniversary of the sell-in of high-margin
event-related products for the Olympic and Paralympic Games as
well as the UEFA EURO 2012. Secondly, we continued to see negative
impacts on Reebok from the NFL licence termination as well as the
finalisation of our clean-up efforts at Reebok India Company. And
thirdly, the NHL lockout, which unfortunately extended into January
2013, negatively impacted our results.
However, I also see a lot of positives in the quarter. We achieved
our key goal to keep our markets and channels clean and healthy.
Throughout the year, we have shown the utmost discipline in managing
our inventories and working capital requirements tightly. So much
so, we finished the year with average operating working capital as
a percentage of sales of 20.0%, well below the prior year level. This also
helped to ensure that our gross margin improved, as lower clearance
sales provided a two percentage point increase for the quarter. We also
continued to show excellent growth in key markets such as Greater
China and European Emerging Markets, where currency-neutral sales
increased 12% and 9%, respectively. In fact, taking all these factors
together, our profitability actually turned out a little better than we had
anticipated for the full year.