Reebok 2012 Annual Report Download - page 163
Download and view the complete annual report
Please find page 163 of the 2012 Reebok annual report below. You can navigate through the pages in the report by either clicking on the pages listed below, or by using the keyword search tool below to find specific information within the annual report.-
 1
1 -
2
-
3
-
4
-
5
-
6
-
7
-
8
-
9
-
10
-
11
-
12
-
13
-
14
-
15
-
16
-
17
-
18
-
19
-
20
-
21
-
22
-
23
-
24
-
25
-
26
-
27
-
28
-
29
-
30
-
31
-
32
-
33
-
34
-
35
-
36
-
37
-
38
-
39
-
40
-
41
-
42
-
43
-
44
-
45
-
46
-
47
-
48
-
49
-
50
-
51
-
52
-
53
-
54
-
55
-
56
-
57
-
58
-
59
-
60
-
61
-
62
-
63
-
64
-
65
-
66
-
67
-
68
-
69
-
70
-
71
-
72
-
73
-
74
-
75
-
76
-
77
-
78
-
79
-
80
-
81
-
82
-
83
-
84
-
85
-
86
-
87
-
88
-
89
-
90
-
91
-
92
-
93
-
94
-
95
-
96
-
97
-
98
-
99
-
100
-
101
-
102
-
103
-
104
-
105
-
106
-
107
-
108
-
109
-
110
-
111
-
112
-
113
-
114
-
115
-
116
-
117
-
118
-
119
-
120
-
121
-
122
-
123
-
124
-
125
-
126
-
127
-
128
-
129
-
130
-
131
-
132
-
133
-
134
-
135
-
136
-
137
-
138
-
139
-
140
-
141
-
142
-
143
-
144
-
145
-
146
-
147
-
148
-
149
-
150
-
151
-
152
-
 153
153 -
 154
154 -
 155
155 -
 156
156 -
 157
157 -
 158
158 -
 159
159 -
 160
160 -
 161
161 -
 162
162 -
 163
163 -
 164
164 -
 165
165 -
 166
166 -
 167
167 -
 168
168 -
 169
169 -
 170
170 -
 171
171 -
 172
172 -
 173
173 -
174
-
175
-
176
-
177
-
178
-
179
-
180
-
181
-
182
-
183
-
184
-
185
-
186
-
187
-
188
-
189
-
190
-
191
-
192
-
193
-
194
-
195
-
196
-
197
-
198
-
199
-
200
-
201
-
202
-
203
-
204
-
205
-
206
-
207
-
208
-
209
-
210
-
211
-
212
-
213
-
214
-
215
-
216
-
217
-
218
-
219
-
220
-
221
-
222
-
223
-
224
-
225
-
226
-
227
-
228
-
229
-
230
-
231
-
232
-
233
-
234
-
235
-
236
-
237
-
238
-
239
-
240
-
241
-
242
-
243
-
244
-
245
-
246
-
247
-
248
-
249
-
250
-
251
-
252
-
253
-
254
-
255
-
256
-
257
-
258
-
259
-
260
-
261
-
262
-
263
-
264
-
265
-
266
-
267
-
268
-
269
-
270
-
271
-
272
-
273
-
274
-
275
-
276
-
277
-
278
-
279
-
280
-
281
-
282
 |
 |

adidas Group
/
2012 Annual Report
Group Management Report – Financial Review
141
2012
/
03.2
/
Group Business Performance
/
Treasur y
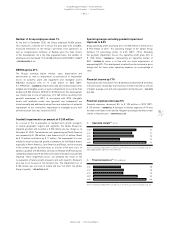
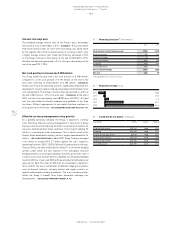
Net cash position of € 448 million
Net cash at December 31, 2012 amounted to € 448 million, compared
to net cash of € 90 million at the end of December 2011, reflecting an
improvement of € 358 million. This development was mainly driven by
the cash flow generated from operating activities and financing activities
over the past twelve months. Currency translation had a positive effect
in an amount of € 3 million. The Group’s ratio of net borrowings over
EBITDA amounted to –0.3 at the end of December 2012 (2011: –0.1).
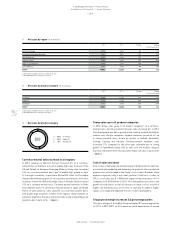
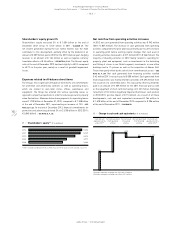
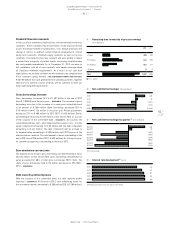
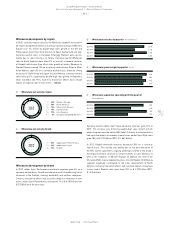
Capital expenditure grows 15%
Capital expenditure is the total cash expenditure for the purchase of
tangible and intangible assets (excluding acquisitions). Group capital
expenditure increased 15% to € 434 million in 2012 (2011: € 376 million).
The Retail segment accounted for 24% of Group capital expenditure
(2011: 26%). Investments primarily related to the expansion of our store
base for the adidas and Reebok brands. Expenditure in the Wholesale
segment accounted for 12% of total capital expenditure (2011: 17%).
Capital expenditure in Other Businesses accounted for 6% of total
expenditure (2011: 7%). The remaining 58% of Group capital expenditure
was recorded in HQ/Consolidation (2011: 50%) and was mainly related
to investments into the Group’s logistics infrastructure, new office
buildings and deployment of IT systems
/
DIAGRAM 41.
Treasury
Group financing policy
In order to be able to meet the Group’s payment commitments at all
times, the major goal of our financing policy is to ensure sufficient
liquidity reserves, while minimising the Group’s financial expenses.
The operating activities of our Group segments and markets and the
resulting cash inflows represent the Group’s main source of liquidity.
Liquidity is planned on a rolling monthly basis under a multi-year
financial and liquidity plan. This comprises all consolidated Group
companies. Our in-house bank concept takes advantage of any surplus
funds of individual Group companies to cover the financial requirements
of others, thus reducing external financing needs and optimising
our net interest expenses. By settling intercompany transactions via
intercompany financial accounts, we are able to reduce external bank
account transactions and thus bank charges. Effective management of
our currency exposure and interest rate risks are additional goals and
responsibilities of our Group Treasury department.
Treasury system and responsibilities
Our Group’s Treasury Policy governs all treasury-related issues,
including banking policy and approval of bank relationships, financing
arrangements and liquidity/asset management, currency and interest
risk management as well as the management of intercompany cash
flows. Responsibilities are arranged in a three-tiered approach:
/
The Treasury Committee consists of members of the Executive Board
and other senior executives who decide on the Group’s Treasury
Policy and provide strategic guidance for managing treasury-related
topics. Major changes to our Treasury Policy are subject to the prior
approval of the Treasury Committee.
/
The Group Treasury department is responsible for specific centralised
treasury transactions and for the global implementation of our
Group’s Treasury Policy.
/
On a subsidiary level, where applicable and economically reasonable,
local managing directors and financial controllers are responsible
for managing treasury matters in their respective subsidiaries.
Controlling functions on a Group level ensure that the transactions
of the individual business units are in compliance with the Group’s
Treasury Policy.
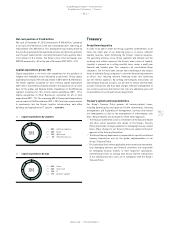
41
/
Capital expenditure by segment
42
/
Capital expenditure by type
2012
2012
1
/
58% HQ/Consolidation
2
/
24% Retail
3
/
12% Wholesale
4
/
6% Other Businesses
1
/
52% Other
2
/
24% Own retail
3
/
13% IT
4
/
11% Retailer support
1
1
2
2
3
3
4
4