Reebok 2012 Annual Report Download - page 138
Download and view the complete annual report
Please find page 138 of the 2012 Reebok annual report below. You can navigate through the pages in the report by either clicking on the pages listed below, or by using the keyword search tool below to find specific information within the annual report.-
 1
1 -
2
-
3
-
4
-
5
-
6
-
7
-
8
-
9
-
10
-
11
-
12
-
13
-
14
-
15
-
16
-
17
-
18
-
19
-
20
-
21
-
22
-
23
-
24
-
25
-
26
-
27
-
28
-
29
-
30
-
31
-
32
-
33
-
34
-
35
-
36
-
37
-
38
-
39
-
40
-
41
-
42
-
43
-
44
-
45
-
46
-
47
-
48
-
49
-
50
-
51
-
52
-
53
-
54
-
55
-
56
-
57
-
58
-
59
-
60
-
61
-
62
-
63
-
64
-
65
-
66
-
67
-
68
-
69
-
70
-
71
-
72
-
73
-
74
-
75
-
76
-
77
-
78
-
79
-
80
-
81
-
82
-
83
-
84
-
85
-
86
-
87
-
88
-
89
-
90
-
91
-
92
-
93
-
94
-
95
-
96
-
97
-
98
-
99
-
100
-
101
-
102
-
103
-
104
-
105
-
106
-
107
-
108
-
109
-
110
-
111
-
112
-
113
-
114
-
115
-
116
-
117
-
118
-
119
-
120
-
121
-
122
-
123
-
124
-
125
-
126
-
127
-
 128
128 -
 129
129 -
 130
130 -
 131
131 -
 132
132 -
 133
133 -
 134
134 -
 135
135 -
 136
136 -
 137
137 -
 138
138 -
 139
139 -
 140
140 -
 141
141 -
 142
142 -
 143
143 -
 144
144 -
 145
145 -
 146
146 -
 147
147 -
 148
148 -
149
-
150
-
151
-
152
-
153
-
154
-
155
-
156
-
157
-
158
-
159
-
160
-
161
-
162
-
163
-
164
-
165
-
166
-
167
-
168
-
169
-
170
-
171
-
172
-
173
-
174
-
175
-
176
-
177
-
178
-
179
-
180
-
181
-
182
-
183
-
184
-
185
-
186
-
187
-
188
-
189
-
190
-
191
-
192
-
193
-
194
-
195
-
196
-
197
-
198
-
199
-
200
-
201
-
202
-
203
-
204
-
205
-
206
-
207
-
208
-
209
-
210
-
211
-
212
-
213
-
214
-
215
-
216
-
217
-
218
-
219
-
220
-
221
-
222
-
223
-
224
-
225
-
226
-
227
-
228
-
229
-
230
-
231
-
232
-
233
-
234
-
235
-
236
-
237
-
238
-
239
-
240
-
241
-
242
-
243
-
244
-
245
-
246
-
247
-
248
-
249
-
250
-
251
-
252
-
253
-
254
-
255
-
256
-
257
-
258
-
259
-
260
-
261
-
262
-
263
-
264
-
265
-
266
-
267
-
268
-
269
-
270
-
271
-
272
-
273
-
274
-
275
-
276
-
277
-
278
-
279
-
280
-
281
-
282
 |
 |
adidas Group
/
2012 Annual Report
Group Management Report – Our Group
116
2012
Employees
/
02.7
/
08
/
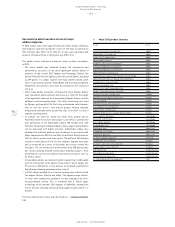
Number of employees 1)
2012 2011
Employees 2) Full-time
equivalents 3)
Employees 2) Full-time
equivalents 3)
Own retail 24,491 19,560 24,649 19,454
Sales 4,853 4,667 5,067 4,697
Logistics 5,363 4,908 5,334 5,167
Marketing 3,851 3,715 3,847 3,716
Central administration 4,018 3,804 3,923 3,703
Production 1,694 1,549 1,969 1,931
Research & development 1,035 994 1,029 990
IT 1,001 970 1,006 979
Total 46,306 40,168 46,824 40,637
1) At year-end.
2) Number of employees on a headcount basis.
3) Number of employees on a full-time equivalent basis. Due to the high share of part-time employees in our Retail segment, this figure is lower than the number of employees counted
on a headcount basis.
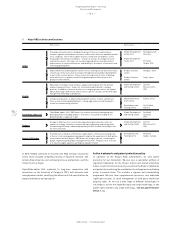
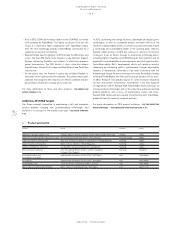
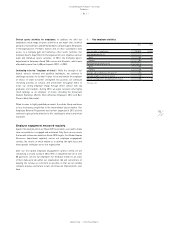
Global employee base decreases 1%
On December 31, 2012, the Group had 46,306 employees, which
represents a decrease of 1% versus 46,824 in the previous
year
/
DIAGRAM 05. This development is primarily related to increased
efficiencies in the Group’s own-retail store base as well as to
reorganisation initiatives at Reebok.
On a full-time equivalent basis, our Group had 40,168 employees on
December 31, 2012 (2011: 40,637). Due to the high share of employees
working on a part-time basis in the Retail segment, this figure is lower
than the figure reported on a headcount basis
/
TABLE 08. Personnel
expenses increased 14% to € 1.872 billion in 2012 from € 1.646 billion in
2011, representing 13% of Group sales (2011: 12%)
/
SEE NOTE 32, P. 230.
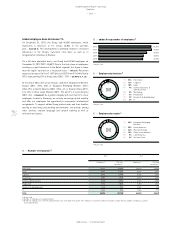
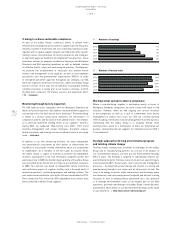
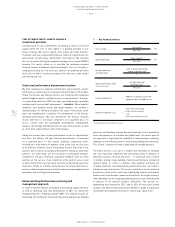
At the end of 2012, 24% of our Group’s staff were employed in Western
Europe (2011: 23%), 30% in European Emerging Markets (2011:
33%), 25% in North America (2011: 25%), 4% in Greater China (2011:
4%), 10% in Other Asian Markets (2011: 9%) and 7% in Latin America
(2011: 6%)
/
DIAGRAM 07. As a global company with less than 12% of our
employees located in Germany, we actively encourage global mobility
and offer our employees the opportunity to experience international
assignments. To support adidas Group professionals and their families
moving to new living and working environments, we provide, among
other services, relevant language and cultural training as well as
relocation assistance.
05
/
adidas Group number of employees 1)
2012 46,306
2011 46,824
2010 42,541
2009 39,596
2008 38,982
1) At year-end.
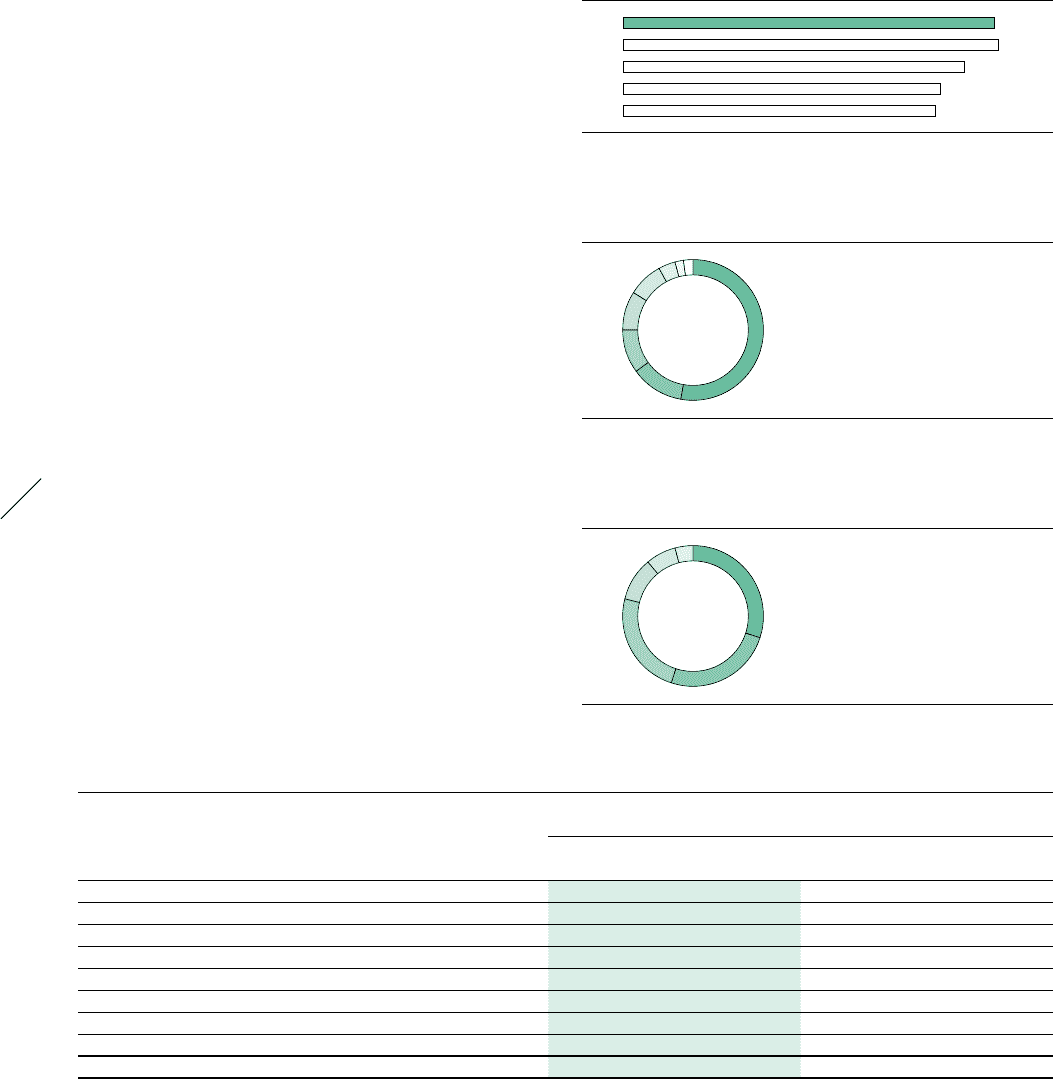
06
/
Employees by function 1)
1) At year-end.
2012
1
/
53% Own retail
2
/
12% Logistics
3
/
10% Sales
4
/
9% Central functions &
administration
5
/
8% Marketing
6
/
4% Production
7
/
2% Research & development
8
/
2% IT
1
2
3
4
5 6 7 8
07
/
Employees by region 1)
1) At year-end.
2012
1
/
30% European Emerging
Markets
2
/
25% North America
3
/
24% Western Europe
4
/
10% Other Asian Markets
5
/
7% Latin America
6
/
4% Greater China
1
2
3
6
4
5