Reebok 2012 Annual Report Download - page 203
Download and view the complete annual report
Please find page 203 of the 2012 Reebok annual report below. You can navigate through the pages in the report by either clicking on the pages listed below, or by using the keyword search tool below to find specific information within the annual report.-
 1
1 -
2
-
3
-
4
-
5
-
6
-
7
-
8
-
9
-
10
-
11
-
12
-
13
-
14
-
15
-
16
-
17
-
18
-
19
-
20
-
21
-
22
-
23
-
24
-
25
-
26
-
27
-
28
-
29
-
30
-
31
-
32
-
33
-
34
-
35
-
36
-
37
-
38
-
39
-
40
-
41
-
42
-
43
-
44
-
45
-
46
-
47
-
48
-
49
-
50
-
51
-
52
-
53
-
54
-
55
-
56
-
57
-
58
-
59
-
60
-
61
-
62
-
63
-
64
-
65
-
66
-
67
-
68
-
69
-
70
-
71
-
72
-
73
-
74
-
75
-
76
-
77
-
78
-
79
-
80
-
81
-
82
-
83
-
84
-
85
-
86
-
87
-
88
-
89
-
90
-
91
-
92
-
93
-
94
-
95
-
96
-
97
-
98
-
99
-
100
-
101
-
102
-
103
-
104
-
105
-
106
-
107
-
108
-
109
-
110
-
111
-
112
-
113
-
114
-
115
-
116
-
117
-
118
-
119
-
120
-
121
-
122
-
123
-
124
-
125
-
126
-
127
-
128
-
129
-
130
-
131
-
132
-
133
-
134
-
135
-
136
-
137
-
138
-
139
-
140
-
141
-
142
-
143
-
144
-
145
-
146
-
147
-
148
-
149
-
150
-
151
-
152
-
153
-
154
-
155
-
156
-
157
-
158
-
159
-
160
-
161
-
162
-
163
-
164
-
165
-
166
-
167
-
168
-
169
-
170
-
171
-
172
-
173
-
174
-
175
-
176
-
177
-
178
-
179
-
180
-
181
-
182
-
183
-
184
-
185
-
186
-
187
-
188
-
189
-
190
-
191
-
192
-
 193
193 -
 194
194 -
 195
195 -
 196
196 -
 197
197 -
 198
198 -
 199
199 -
 200
200 -
 201
201 -
 202
202 -
 203
203 -
 204
204 -
 205
205 -
 206
206 -
 207
207 -
 208
208 -
 209
209 -
 210
210 -
 211
211 -
 212
212 -
 213
213 -
214
-
215
-
216
-
217
-
218
-
219
-
220
-
221
-
222
-
223
-
224
-
225
-
226
-
227
-
228
-
229
-
230
-
231
-
232
-
233
-
234
-
235
-
236
-
237
-
238
-
239
-
240
-
241
-
242
-
243
-
244
-
245
-
246
-
247
-
248
-
249
-
250
-
251
-
252
-
253
-
254
-
255
-
256
-
257
-
258
-
259
-
260
-
261
-
262
-
263
-
264
-
265
-
266
-
267
-
268
-
269
-
270
-
271
-
272
-
273
-
274
-
275
-
276
-
277
-
278
-
279
-
280
-
281
-
282
 |
 |

adidas Group
/
2012 Annual Report
Group Management Report – Financial Review
181
2012
/
03.5
/
Risk and Opportunity Report
/
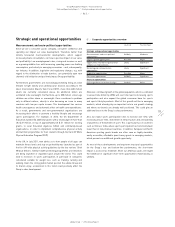
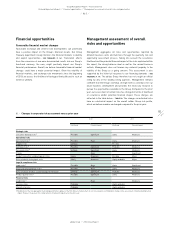
Strategic and operational opportunities
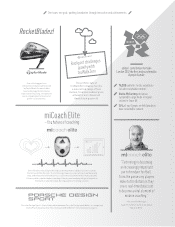
Digital interactivity: Consumer demand for digital interactivity has
increased significantly in recent years as consumers realise the benefits
of incorporating real-time data on metrics such as distance, speed
and heart rate into their training routines and into their performance
on the field. The design and development of this functionality requires
significantly more expertise, product and material research, as well as
production know-how compared to traditional footwear and apparel.
Our resources and our positioning as a sport performance leader as
well as collaborations with experts in technology and in the field of
analysing data related to athletes’ movement and performance are
beginning to open up new opportunities. For example, in July 2012,
together with Major League Soccer in the USA, adidas launched the
miCoach Elite System for football, building on the brand’s success in
personalised digital coaching. The miCoach Elite System includes a data
cell – Speed_Cell – that fits into a protective pocket between the shoulder
blades of the player’s apparel base layer. By measuring every move,
heartbeat and step, this technology enables a better understanding of
the player’s performance and helps monitor the workload of an individual
player, compare one athlete with another or view the whole team to gain
a complete picture of the squad
/
SEE RESEARCH AND DEVELOPMENT, P. 105.
As consumer demand for this type of functionality increases, and with
further advances in technology, we expect that similar opportunities will
also exist in other sports categories.
Sustainable products: As consumers demand more products that are
environmentally benign and produced on a sustainable basis, the adidas
Group continues its efforts to create meaningful product platforms
that drive growth in this area. We remain focused on the extension of
the adidas ”Better Place” programme. Products and packaging in the
programme are designed taking sustainability principles into account,
such as broadening the use of recycled materials and monitoring energy
use in material and product preparation. For example, 90% of all adidas
products for the London 2012 Olympic Games contained sustainable
content. Furthermore, 100% of athlete Village wear, 100% of Volunteer
wear and 73% of on-field performance products were designed and
developed as “Better Place” products
/
SEE SUSTAINABILITY, P. 117.
Strategic partnerships: The adidas Group in recent years has also
extended its partnership network beyond sports, be it with academic
organisations in research and development, designers in the fashion
industry, other brands or non-traditional sporting goods retailers. These
partnerships have generated multiple new growth avenues for the Group,
as we have acquired product or process know-how and gained access
to new distribution channels or markets. For example, our partnership
with a leading denim manufacturer allowed us to gain experience with
that type of product, which eventually helped us to establish it under
our own brand name via adidas Originals and the adidas NEO label.
Therefore, new partnerships in the future may enable the adidas Group
to pursue further growth opportunities.
Taking all these together, we see many long-term organic growth
opportunities and regard the potential impact as major. However, we
assess the likelihood of being positively affected to such an extent in the
short term as only possible.
Opportunities related to organisational and
process improvements
Continued optimisation of key business processes and strict cost
control are vital to achieving high profitability and return on invested
capital. We are confident that there is still significant opportunity to
further streamline cost structures throughout our Group. For example,
we continuously search for ways to increase efficiency in our supply
chain and make it truly demand-driven. Furthermore, by implementing
end-to-end planning processes and improving our replenishment
capabilities, we see opportunities not only to better serve our customers
but also to reduce our operating working capital needs. Another
example in this respect is the reduction of the number of articles; this
reduces complexity and workload in the creation area and warehouse
costs, and allows us to offer more focused and consistent ranges to our
retail partners.
Furthermore, constant improvements in manufacturing excellence,
such as process simplification, manufacturing innovation or warehouse
consolidation, may help us optimise our production efficiency and
significantly increase profitability for the Group. Innovations in production
could also support the Group in reducing its environmental impact, while
at the same time enabling the Group to provide consumers with the best
value proposition possible. For example, a higher level of automation in
the production processes for footwear and apparel manufacturing could
result in productivity enhancements, shorten lead times and improve
overall quality. We have already implemented state-of-the-art machinery
and solutions such as computer stitching and welding, high-frequency
cutting and automated production lines across factories.
In addition, consolidating and upgrading our distribution centres
represents an opportunity for the Group to realise further efficiency
gains, reduce operating overheads and provide the operational ability to
drive additional revenue growth. In 2012, for example, the adidas Group
completed the construction of and move to two state-of-the-art, multi-
brand warehouses in South Korea and Mexico, in both cases combining
multiple legacy facilities into one facility
/
SEE GLOBAL OPERATIONS, P. 100.
Process improvements in other areas of the Group’s business activities
could also positively impact profitability. For example, we are investing
considerable resources in developing our product virtualisation
capabilities, as we believe virtualisation can bring us substantial
benefits in terms of speed, innovation, cost saving, sustainability and
creativity
/
SEE RESEARCH AND DEVELOPMENT, P. 105.
Overall, we assess the potential impact of organisational and process
improvements as significant. Given our numerous initiatives to improve
efficiency and operational excellence, we regard the likelihood that such
opportunities materialise as likely.