Reebok 2012 Annual Report Download - page 256
Download and view the complete annual report
Please find page 256 of the 2012 Reebok annual report below. You can navigate through the pages in the report by either clicking on the pages listed below, or by using the keyword search tool below to find specific information within the annual report.-
 1
1 -
2
-
3
-
4
-
5
-
6
-
7
-
8
-
9
-
10
-
11
-
12
-
13
-
14
-
15
-
16
-
17
-
18
-
19
-
20
-
21
-
22
-
23
-
24
-
25
-
26
-
27
-
28
-
29
-
30
-
31
-
32
-
33
-
34
-
35
-
36
-
37
-
38
-
39
-
40
-
41
-
42
-
43
-
44
-
45
-
46
-
47
-
48
-
49
-
50
-
51
-
52
-
53
-
54
-
55
-
56
-
57
-
58
-
59
-
60
-
61
-
62
-
63
-
64
-
65
-
66
-
67
-
68
-
69
-
70
-
71
-
72
-
73
-
74
-
75
-
76
-
77
-
78
-
79
-
80
-
81
-
82
-
83
-
84
-
85
-
86
-
87
-
88
-
89
-
90
-
91
-
92
-
93
-
94
-
95
-
96
-
97
-
98
-
99
-
100
-
101
-
102
-
103
-
104
-
105
-
106
-
107
-
108
-
109
-
110
-
111
-
112
-
113
-
114
-
115
-
116
-
117
-
118
-
119
-
120
-
121
-
122
-
123
-
124
-
125
-
126
-
127
-
128
-
129
-
130
-
131
-
132
-
133
-
134
-
135
-
136
-
137
-
138
-
139
-
140
-
141
-
142
-
143
-
144
-
145
-
146
-
147
-
148
-
149
-
150
-
151
-
152
-
153
-
154
-
155
-
156
-
157
-
158
-
159
-
160
-
161
-
162
-
163
-
164
-
165
-
166
-
167
-
168
-
169
-
170
-
171
-
172
-
173
-
174
-
175
-
176
-
177
-
178
-
179
-
180
-
181
-
182
-
183
-
184
-
185
-
186
-
187
-
188
-
189
-
190
-
191
-
192
-
193
-
194
-
195
-
196
-
197
-
198
-
199
-
200
-
201
-
202
-
203
-
204
-
205
-
206
-
207
-
208
-
209
-
210
-
211
-
212
-
213
-
214
-
215
-
216
-
217
-
218
-
219
-
220
-
221
-
222
-
223
-
224
-
225
-
226
-
227
-
228
-
229
-
230
-
231
-
232
-
233
-
234
-
235
-
236
-
237
-
238
-
239
-
240
-
241
-
242
-
243
-
244
-
245
-
 246
246 -
 247
247 -
 248
248 -
 249
249 -
 250
250 -
 251
251 -
 252
252 -
 253
253 -
 254
254 -
 255
255 -
 256
256 -
 257
257 -
 258
258 -
 259
259 -
 260
260 -
 261
261 -
 262
262 -
 263
263 -
 264
264 -
 265
265 -
 266
266 -
267
-
268
-
269
-
270
-
271
-
272
-
273
-
274
-
275
-
276
-
277
-
278
-
279
-
280
-
281
-
282
 |
 |

adidas Group
/
2012 Annual Report
Consolidated Financial Statements
234
2012
/
04.8
/
Notes
/
Notes – Additional Information
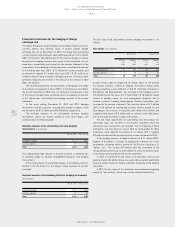
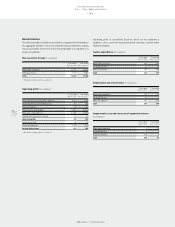
Reconciliations
The following tables include reconciliations of segmental information to
the aggregate numbers of the consolidated financial statements, taking
into account items which are not directly attributable to a segment or a
group of segments.
Net sales (non-Group) (€ in millions)
Year ending
Dec. 31, 2012
Year ending
Dec. 31, 2011 1)
Reportable segments 12,906 11,742
Other businesses 1,977 1,580
Total 14,883 13,322
1) Restated according to IAS 8, see Note 03.
Operating profit (€ in millions)
Year ending
Dec. 31, 2012
Year ending
Dec. 31, 2011 1)
Operating profit for reportable segments 3,689 3,283
Operating profit for other businesses 541 427
HQ/Consolidation 345 292
Marketing working budget (1,502) (1,362)
Other operating expenses (2,258) (1,780)
Royalty and commission income 105 93
Operating profit 920 953
Financial income 36 31
Financial expenses (105) (115)
Income before taxes 851 869
1) Restated according to IAS 8, see Note 03.
Operating profit of centralised functions which do not represent a
segment, such as central treasury and global sourcing, is shown under
HQ/Consolidation.
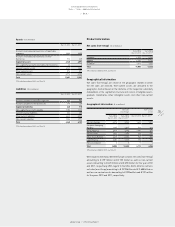
Capital expenditure (€ in millions)
Year ending
Dec. 31, 2012
Year ending
Dec. 31, 2011
Reportable segments 156 161
Other businesses 28 28
HQ/Consolidation 250 187
Total 434 376
Depreciation and amortisation (€ in millions)
Year ending
Dec. 31, 2012
Year ending
Dec. 31, 2011
Reportable segments 122 110
Other businesses 11 9
HQ/Consolidation 127 130
Total 260 249
Impairment losses and reversals of impairment losses
(€ in millions)
Year ending
Dec. 31, 2012
Year ending
Dec. 31, 2011
Reportable segments 3 (1)
Other businesses 0 0
HQ/Consolidation 265 0
Total 268 (1)