Reebok 2012 Annual Report Download - page 257
Download and view the complete annual report
Please find page 257 of the 2012 Reebok annual report below. You can navigate through the pages in the report by either clicking on the pages listed below, or by using the keyword search tool below to find specific information within the annual report.-
 1
1 -
2
-
3
-
4
-
5
-
6
-
7
-
8
-
9
-
10
-
11
-
12
-
13
-
14
-
15
-
16
-
17
-
18
-
19
-
20
-
21
-
22
-
23
-
24
-
25
-
26
-
27
-
28
-
29
-
30
-
31
-
32
-
33
-
34
-
35
-
36
-
37
-
38
-
39
-
40
-
41
-
42
-
43
-
44
-
45
-
46
-
47
-
48
-
49
-
50
-
51
-
52
-
53
-
54
-
55
-
56
-
57
-
58
-
59
-
60
-
61
-
62
-
63
-
64
-
65
-
66
-
67
-
68
-
69
-
70
-
71
-
72
-
73
-
74
-
75
-
76
-
77
-
78
-
79
-
80
-
81
-
82
-
83
-
84
-
85
-
86
-
87
-
88
-
89
-
90
-
91
-
92
-
93
-
94
-
95
-
96
-
97
-
98
-
99
-
100
-
101
-
102
-
103
-
104
-
105
-
106
-
107
-
108
-
109
-
110
-
111
-
112
-
113
-
114
-
115
-
116
-
117
-
118
-
119
-
120
-
121
-
122
-
123
-
124
-
125
-
126
-
127
-
128
-
129
-
130
-
131
-
132
-
133
-
134
-
135
-
136
-
137
-
138
-
139
-
140
-
141
-
142
-
143
-
144
-
145
-
146
-
147
-
148
-
149
-
150
-
151
-
152
-
153
-
154
-
155
-
156
-
157
-
158
-
159
-
160
-
161
-
162
-
163
-
164
-
165
-
166
-
167
-
168
-
169
-
170
-
171
-
172
-
173
-
174
-
175
-
176
-
177
-
178
-
179
-
180
-
181
-
182
-
183
-
184
-
185
-
186
-
187
-
188
-
189
-
190
-
191
-
192
-
193
-
194
-
195
-
196
-
197
-
198
-
199
-
200
-
201
-
202
-
203
-
204
-
205
-
206
-
207
-
208
-
209
-
210
-
211
-
212
-
213
-
214
-
215
-
216
-
217
-
218
-
219
-
220
-
221
-
222
-
223
-
224
-
225
-
226
-
227
-
228
-
229
-
230
-
231
-
232
-
233
-
234
-
235
-
236
-
237
-
238
-
239
-
240
-
241
-
242
-
243
-
244
-
245
-
246
-
 247
247 -
 248
248 -
 249
249 -
 250
250 -
 251
251 -
 252
252 -
 253
253 -
 254
254 -
 255
255 -
 256
256 -
 257
257 -
 258
258 -
 259
259 -
 260
260 -
 261
261 -
 262
262 -
 263
263 -
 264
264 -
 265
265 -
 266
266 -
 267
267 -
268
-
269
-
270
-
271
-
272
-
273
-
274
-
275
-
276
-
277
-
278
-
279
-
280
-
281
-
282
 |
 |
adidas Group
/
2012 Annual Report
Consolidated Financial Statements
235
2012
/
04.8
/
Notes
/
Notes – Additional Information
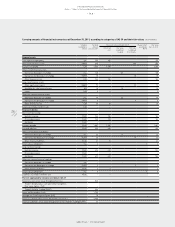
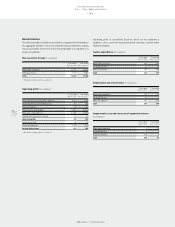
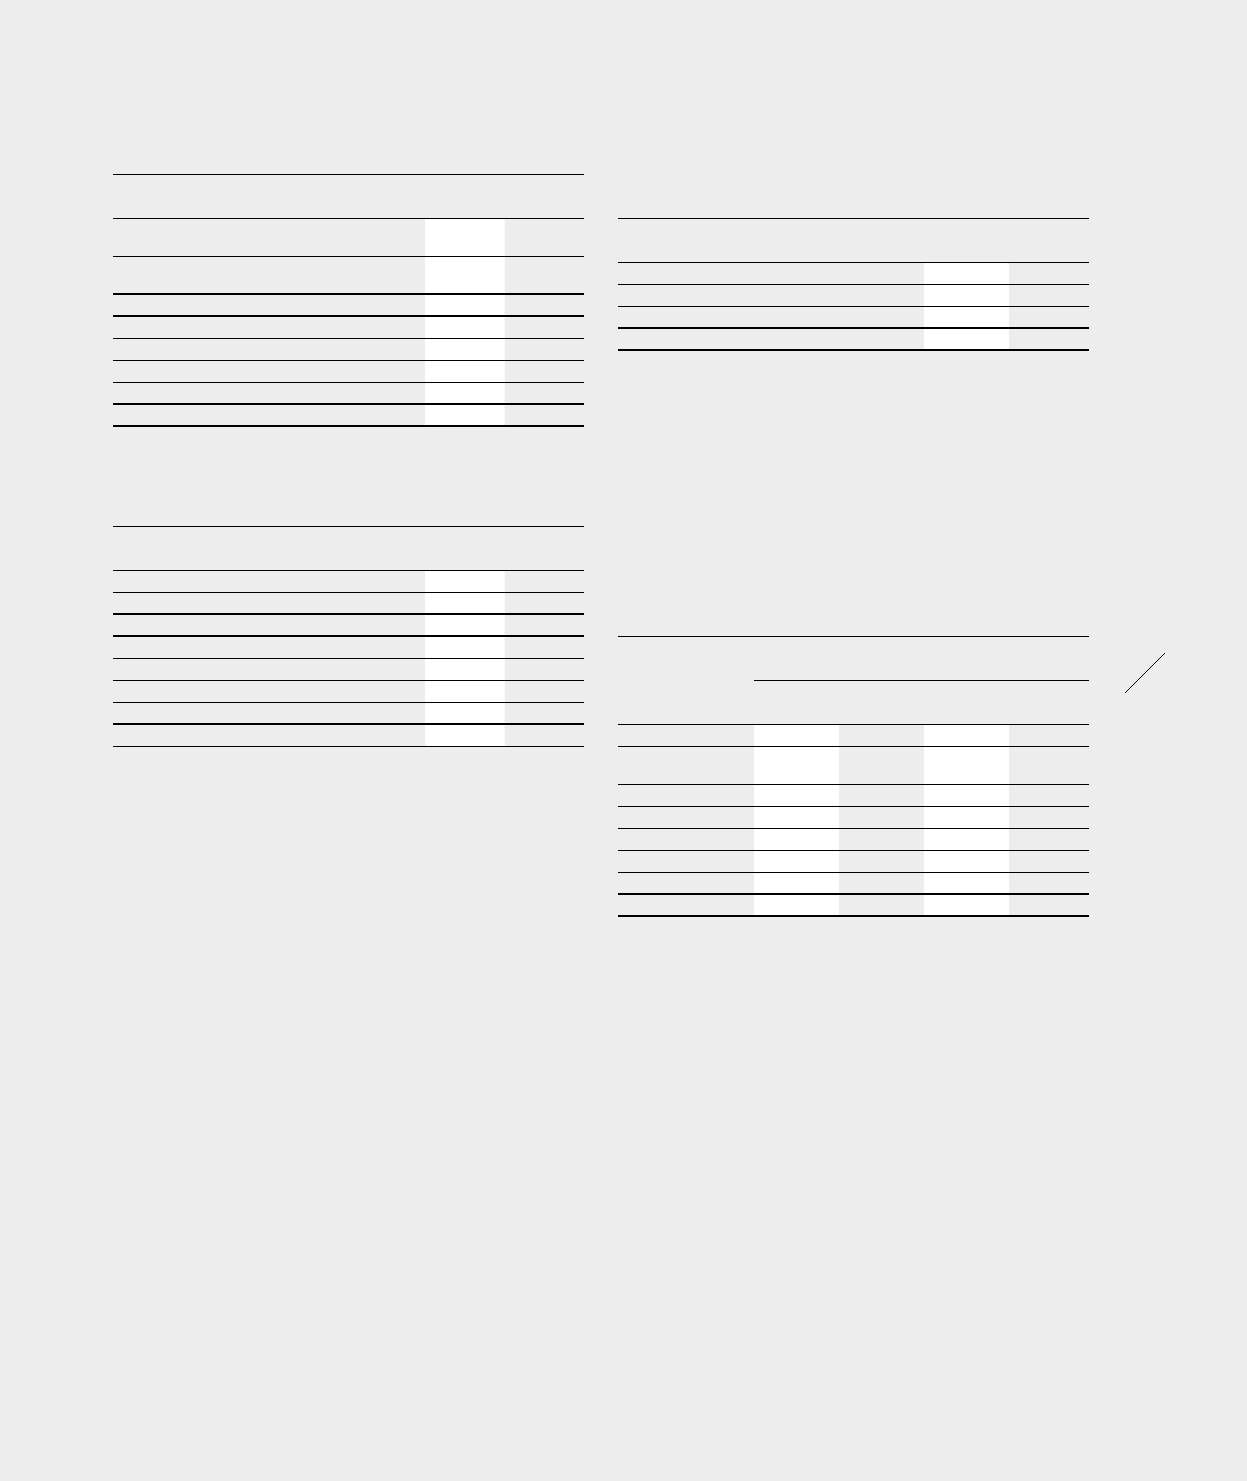
Assets (€ in millions)
Dec. 31, 2012 Dec. 31, 2011 1)
Accounts receivable and inventories of reportable
segments 3,436 3,455
Accounts receivable and inventories of other
businesses 712 638
Segmental assets 4,148 4,093
Non-segmental accounts receivable and inventories 26 4
Current financial assets 2,127 1,660
Other current assets 576 571
Non-current assets 4,774 4,909
Total 11,651 11,237
1) Restated according to IAS 8, see Note 03.
Liabilities (€ in millions)
Dec. 31, 2012 Dec. 31, 2011 1)
Accounts payable of reportable segments 450 580
Accounts payable of other businesses 190 138
Segmental liabilities 640 718
Non-segmental accounts payable 1,150 1,169
Current financial liabilities 364 355
Other current liabilities 2,220 2,096
Non-current liabilities 1,986 1,771
Total 6,360 6,109
1) Restated according to IAS 8, see Note 03.
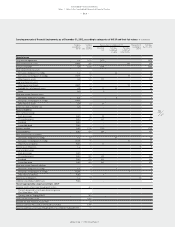
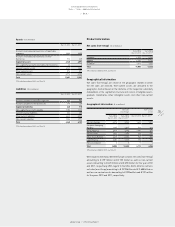
Product information
Net sales (non-Group) (€ in millions)
Year ending
Dec. 31, 2012
Year ending
Dec. 31, 2011 1)
Footwear 6,922 6,242
Apparel 6,290 5,733
Hardware 1,671 1,347
Total 14,883 13,322
1) Restated according to IAS 8, see Note 03.
Geographical information
Net sales (non-Group) are shown in the geographic market in which
the net sales are realised. Non-current assets are allocated to the
geographic market based on the domicile of the respective subsidiary
independent of the segmental structure and consist of tangible assets,
goodwill, trademarks, other intangible assets and other non-current
assets.
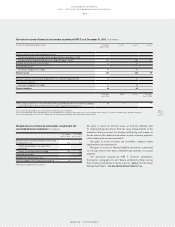
Geographical information (€ in millions)
Net sales
(non-Group)
Non-current
assets
Year ending
Dec. 31, 2012
Year ending
Dec. 31, 2011 1)
Dec. 31, 2012 Dec. 31, 2011 1)
Western Europe 4,076 3,922 1,449 1,511
European Emerging
Markets 1,947 1,597 599 653
North America 3,410 3,102 1,080 877
Greater China 1,562 1,229 274 482
Other Asian Markets 2,407 2,103 536 554
Latin America 1,481 1,369 175 209
HQ/Consolidation 0 0 0 0
Total 14,883 13,322 4,113 4,286
1) Restated according to IAS 8, see Note 03.
With regard to Germany, Western Europe contains net sales (non-Group)
amounting to € 739 million and € 722 million as well as non-current
assets amounting to € 673 million and € 393 million for the years 2012
and 2011, respectively. With regard to the USA, North America contains
net sales (non-Group) amounting to € 2.978 billion and € 2.688 billion as
well as non-current assets amounting to € 928 million and € 701 million
for the years 2012 and 2011, respectively.