Reebok 2012 Annual Report Download - page 237
Download and view the complete annual report
Please find page 237 of the 2012 Reebok annual report below. You can navigate through the pages in the report by either clicking on the pages listed below, or by using the keyword search tool below to find specific information within the annual report.-
 1
1 -
2
-
3
-
4
-
5
-
6
-
7
-
8
-
9
-
10
-
11
-
12
-
13
-
14
-
15
-
16
-
17
-
18
-
19
-
20
-
21
-
22
-
23
-
24
-
25
-
26
-
27
-
28
-
29
-
30
-
31
-
32
-
33
-
34
-
35
-
36
-
37
-
38
-
39
-
40
-
41
-
42
-
43
-
44
-
45
-
46
-
47
-
48
-
49
-
50
-
51
-
52
-
53
-
54
-
55
-
56
-
57
-
58
-
59
-
60
-
61
-
62
-
63
-
64
-
65
-
66
-
67
-
68
-
69
-
70
-
71
-
72
-
73
-
74
-
75
-
76
-
77
-
78
-
79
-
80
-
81
-
82
-
83
-
84
-
85
-
86
-
87
-
88
-
89
-
90
-
91
-
92
-
93
-
94
-
95
-
96
-
97
-
98
-
99
-
100
-
101
-
102
-
103
-
104
-
105
-
106
-
107
-
108
-
109
-
110
-
111
-
112
-
113
-
114
-
115
-
116
-
117
-
118
-
119
-
120
-
121
-
122
-
123
-
124
-
125
-
126
-
127
-
128
-
129
-
130
-
131
-
132
-
133
-
134
-
135
-
136
-
137
-
138
-
139
-
140
-
141
-
142
-
143
-
144
-
145
-
146
-
147
-
148
-
149
-
150
-
151
-
152
-
153
-
154
-
155
-
156
-
157
-
158
-
159
-
160
-
161
-
162
-
163
-
164
-
165
-
166
-
167
-
168
-
169
-
170
-
171
-
172
-
173
-
174
-
175
-
176
-
177
-
178
-
179
-
180
-
181
-
182
-
183
-
184
-
185
-
186
-
187
-
188
-
189
-
190
-
191
-
192
-
193
-
194
-
195
-
196
-
197
-
198
-
199
-
200
-
201
-
202
-
203
-
204
-
205
-
206
-
207
-
208
-
209
-
210
-
211
-
212
-
213
-
214
-
215
-
216
-
217
-
218
-
219
-
220
-
221
-
222
-
223
-
224
-
225
-
226
-
 227
227 -
 228
228 -
 229
229 -
 230
230 -
 231
231 -
 232
232 -
 233
233 -
 234
234 -
 235
235 -
 236
236 -
 237
237 -
 238
238 -
 239
239 -
 240
240 -
 241
241 -
 242
242 -
 243
243 -
 244
244 -
 245
245 -
 246
246 -
 247
247 -
248
-
249
-
250
-
251
-
252
-
253
-
254
-
255
-
256
-
257
-
258
-
259
-
260
-
261
-
262
-
263
-
264
-
265
-
266
-
267
-
268
-
269
-
270
-
271
-
272
-
273
-
274
-
275
-
276
-
277
-
278
-
279
-
280
-
281
-
282
 |
 |

adidas Group
/
2012 Annual Report
Consolidated Financial Statements
215
2012
/
04.8
/
Notes
/
Notes to the Consolidated Statement of Financial Position
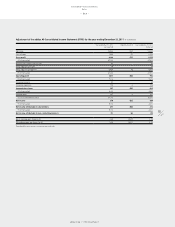
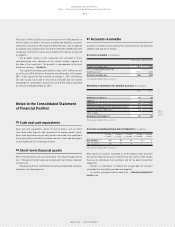
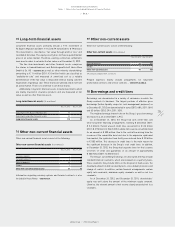
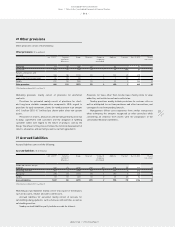
15 Long-term financial assets
Long-term financial assets primarily include a 9.1% investment in
FC Bayern München AG (2011: 9.1%) of € 79 million (2011: € 79 million).
This investment is classified as “fair value through profit or loss” and
recorded at fair value. This equity security does not have a quoted market
price in an active market. Therefore, existing contractual settlements
were used in order to calculate the fair value as at December 31, 2012.
The line item investments and other financial assets comprises
the shares in Immobilieninvest und Betriebsgesellschaft Herzo-Base
GmbH & Co. KG
/
SEE NOTE 04 as well as other minority shareholdings
amounting to € 11 million (2011: € 0 million) which are classified as
“available-for-sale” and measured at amortised cost as a reliable
determination of the fair value is impossible without having concrete
negotiations regarding a sale. These shares are unlisted and do not have
an active market. There is no intention to sell these shares.
Additionally, long-term financial assets include investments which
are mainly invested in insurance products and are measured at fair
value, as well as other financial assets.
Long-term financial assets (€ in millions)
Dec. 31, 2012 Dec. 31, 2011
Investment in FC Bayern München AG 79 79
Investments and other financial assets 33 18
Long-term financial assets 112 97
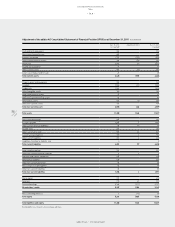
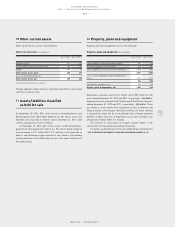
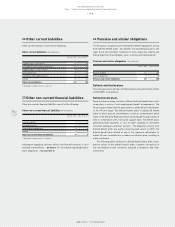
16 Other non-current financial assets
Other non-current financial assets consist of the following:
Other non-current financial assets (€ in millions)
Dec. 31, 2012 Dec. 31, 2011
Currency options – 8
Forward contracts 0 10
Security deposits 20 22
Sundry 1 2
Other non-current financial assets 21 42
Information regarding currency options and forward contracts is also
included in these Notes
/
SEE NOTE 29.
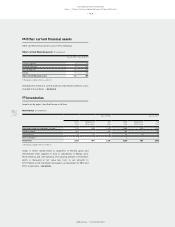
17 Other non-current assets
Other non-current assets consist of the following:
Other non-current assets (€ in millions)
Dec. 31, 2012 Dec. 31, 2011 1)
Prepaid expenses 86 105
Sundry 0 2
Other non-current assets 86 107
1) Restated according to IAS 8, see Note 03.
Prepaid expenses mainly include prepayments for long-term
promotional contracts and service contracts
/
SEE NOTES 38 AND 28.
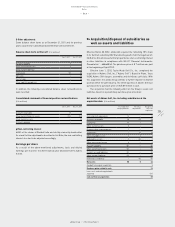
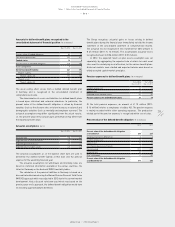
18 Borrowings and credit lines
Borrowings are denominated in a variety of currencies in which the
Group conducts its business. The largest portions of effective gross
borrowings (before liquidity swaps for cash management purposes) as
at December 31, 2012 are denominated in euros (2012: 68%; 2011: 56%)
and US dollars (2012: 29%; 2011: 35%).
The weighted average interest rate on the Group’s gross borrowings
decreased to 4.4% in 2012 (2011: 4.9%).
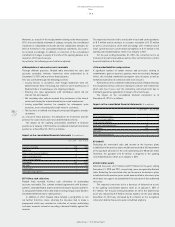
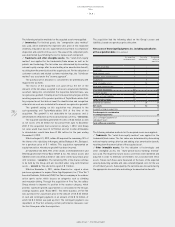
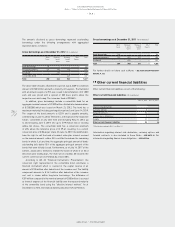
As at December 31, 2012, the Group had cash credit lines and
other long-term financing arrangements totalling € 3.8 billion (2011:
€ 5.2 billion); thereof unused credit lines accounted for € 2.3 billion
(2011: € 3.9 billion). In March 2012, adidas AG issued a convertible bond
for an amount of € 500 million. Due to the cash inflow arising from the
issuance of the convertible bond and due to the expensive syndicated
loan market, the syndicated loan facility was reduced from € 2.0 billion
to € 500 million. This decrease in credit lines is the main reason for
the significant decrease in the Group’s total credit lines. In addition,
at December 31, 2012, the Group had separate lines for the issuance
of letters of credit and guarantees in an amount of approximately
€ 200 million (2011: € 200 million).
The Group’s outstanding financings are unsecured and may include
standard financial covenants, which are reviewed on a quarterly basis.
These covenants may include limits on the disposal of fixed assets, the
maximum amount of debt secured by liens, cross default provisions and
change of control. In addition, certain financial arrangements contain
equity ratio covenants, minimum equity covenants as well as net loss
covenants.
As at December 31, 2012, and December 31, 2011, shareholders’
equity was well above the amount of the minimum equity covenant.
Likewise, the relevant amount of net income clearly exceeded net loss
covenants.