Reebok 2012 Annual Report Download - page 2
Download and view the complete annual report
Please find page 2 of the 2012 Reebok annual report below. You can navigate through the pages in the report by either clicking on the pages listed below, or by using the keyword search tool below to find specific information within the annual report.-
 1
1 -
 2
2 -
 3
3 -
 4
4 -
 5
5 -
 6
6 -
 7
7 -
 8
8 -
 9
9 -
 10
10 -
 11
11 -
 12
12 -
 13
13 -
14
-
15
-
16
-
17
-
18
-
19
-
20
-
21
-
22
-
23
-
24
-
25
-
26
-
27
-
28
-
29
-
30
-
31
-
32
-
33
-
34
-
35
-
36
-
37
-
38
-
39
-
40
-
41
-
42
-
43
-
44
-
45
-
46
-
47
-
48
-
49
-
50
-
51
-
52
-
53
-
54
-
55
-
56
-
57
-
58
-
59
-
60
-
61
-
62
-
63
-
64
-
65
-
66
-
67
-
68
-
69
-
70
-
71
-
72
-
73
-
74
-
75
-
76
-
77
-
78
-
79
-
80
-
81
-
82
-
83
-
84
-
85
-
86
-
87
-
88
-
89
-
90
-
91
-
92
-
93
-
94
-
95
-
96
-
97
-
98
-
99
-
100
-
101
-
102
-
103
-
104
-
105
-
106
-
107
-
108
-
109
-
110
-
111
-
112
-
113
-
114
-
115
-
116
-
117
-
118
-
119
-
120
-
121
-
122
-
123
-
124
-
125
-
126
-
127
-
128
-
129
-
130
-
131
-
132
-
133
-
134
-
135
-
136
-
137
-
138
-
139
-
140
-
141
-
142
-
143
-
144
-
145
-
146
-
147
-
148
-
149
-
150
-
151
-
152
-
153
-
154
-
155
-
156
-
157
-
158
-
159
-
160
-
161
-
162
-
163
-
164
-
165
-
166
-
167
-
168
-
169
-
170
-
171
-
172
-
173
-
174
-
175
-
176
-
177
-
178
-
179
-
180
-
181
-
182
-
183
-
184
-
185
-
186
-
187
-
188
-
189
-
190
-
191
-
192
-
193
-
194
-
195
-
196
-
197
-
198
-
199
-
200
-
201
-
202
-
203
-
204
-
205
-
206
-
207
-
208
-
209
-
210
-
211
-
212
-
213
-
214
-
215
-
216
-
217
-
218
-
219
-
220
-
221
-
222
-
223
-
224
-
225
-
226
-
227
-
228
-
229
-
230
-
231
-
232
-
233
-
234
-
235
-
236
-
237
-
238
-
239
-
240
-
241
-
242
-
243
-
244
-
245
-
246
-
247
-
248
-
249
-
250
-
251
-
252
-
253
-
254
-
255
-
256
-
257
-
258
-
259
-
260
-
261
-
262
-
263
-
264
-
265
-
266
-
267
-
268
-
269
-
270
-
271
-
272
-
273
-
274
-
275
-
276
-
277
-
278
-
279
-
280
-
281
-
282
 |
 |
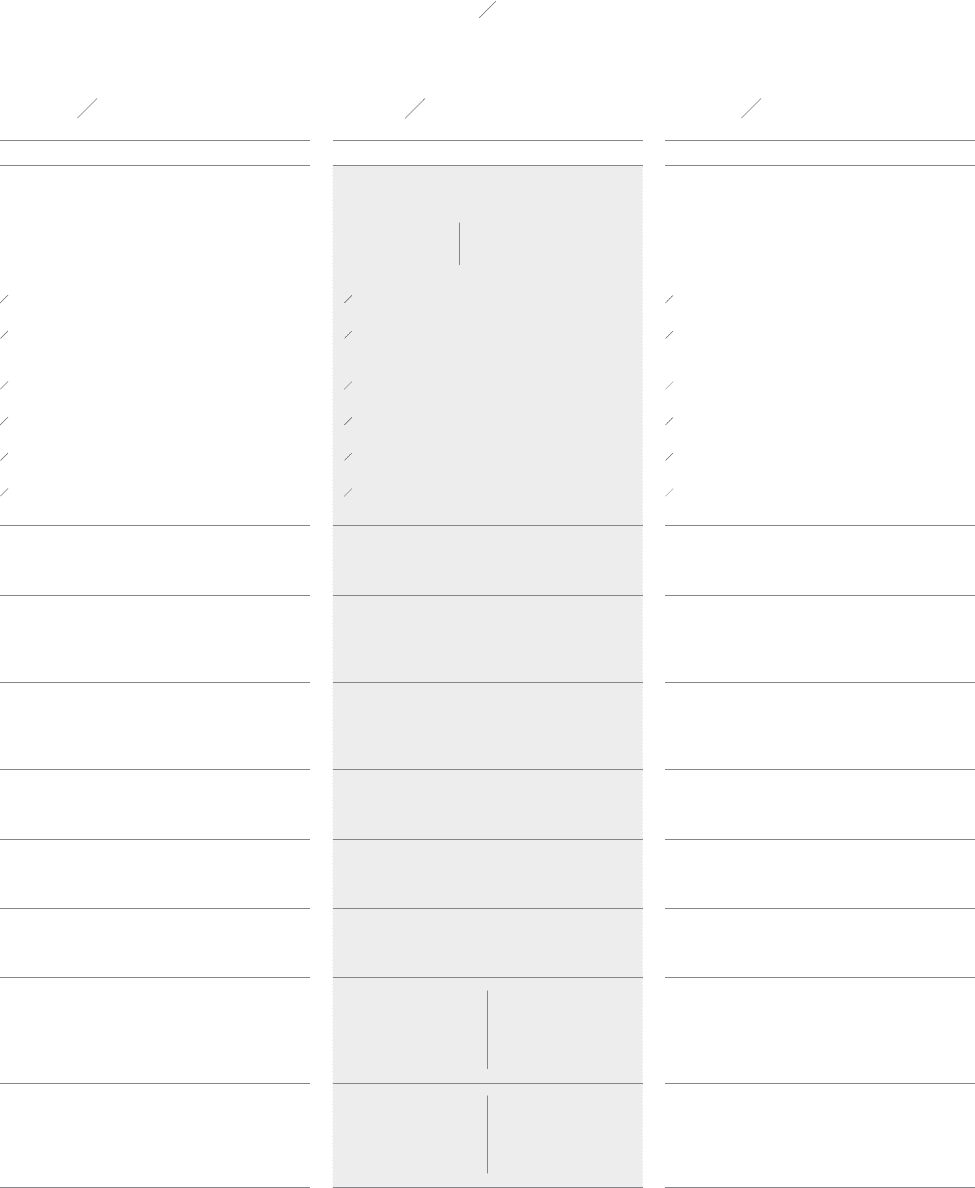
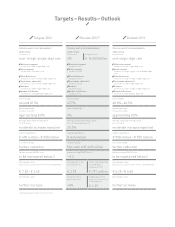
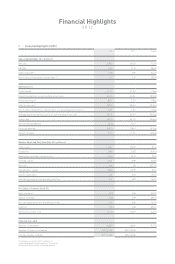
Targets 2012 Results 2012 1) Outlook 2013
Currency-neutral sales development:
adidas Group
increase at a
mid- to high-single-digit rate
Wholesale segment
increase at a mid-single-digit rate
Retail segment
increase at a low-teens rate
Other Businesses
increase at a low- to mid-single-digit rate
TaylorMade-adidas Golf
increase at a low- to mid-single-digit rate
Rockport
increase at a high-single-digit rate
Reebok-CCM Hockey
increase at a strong double-digit rate
Currency-neutral sales development:
adidas Group
increase of Group sales of
6% € 14.883 billion
Wholesale segment
increase of 2%
Retail segment
increase of 14%
Other Businesses
increase of 17%
TaylorMade-adidas Golf
increase of 20%
Rockport
increase of 2%
Reebok-CCM Hockey
increase of 9%
Currency-neutral sales development:
adidas Group
increase at a
mid-single-digit rate
Wholesale segment
increase at a low-single-digit rate
Retail segment
increase at a high-single- to low-double-digit
rate
Other Businesses
increase at a mid- to high-single-digit rate
TaylorMade-adidas Golf
increase at a mid-single-digit rate
Rockport
increase at a mid- to high-single-digit rate
Reebok-CCM Hockey
increase at a low-double-digit rate
Gross margin
around 47.5%
Gross margin
47.7%
Gross margin
48.0% – 48.5%
Operating margin
increase to a level
approaching 8.0%
Operating margin
8%
Operating margin
increase to a level
approaching 9.0%
Average operating working capital
(in % of sales)
moderate increase expected
Average operating working capital
(in % of sales) decreases to
20.0%
Average operating working capital
(in % of sales)
moderate increase expected
Capital expenditure
€ 400 million – € 450 million
Capital expenditure
€ 434 million
Capital expenditure
€ 500 million – € 550 million
Gross borrowings
further reduction
Net borrowings
Net cash of € 448 million
Gross borrowings
further reduction
Net borrowings/EBITDA ratio
to be maintained below 2
Net borrowings/EBITDA ratio
– 0.3
Net borrowings/EBITDA ratio
to be maintained below 2
Earnings per share
increase at a rate of 10% to 15% to a level between
€ 3.52 – € 3.68
Earnings per share
increase 29% to
€ 3.78
Net income attributable
to shareholders
increases 29% to
€ 791 million
Earnings per share
Increase at a rate of 12% to 16% to a level between
€ 4.25 – € 4.40
Shareholder value
further increase
adidas AG share
price increases
34%
Dividend per share
(subject to Annual General
Meeting approval)
€ 1.35
Shareholder value
further increase
Targets – Results – Outlook
1) Excluding goodwill impairment of € 265 million.