Reebok 2012 Annual Report Download - page 255
Download and view the complete annual report
Please find page 255 of the 2012 Reebok annual report below. You can navigate through the pages in the report by either clicking on the pages listed below, or by using the keyword search tool below to find specific information within the annual report.-
 1
1 -
2
-
3
-
4
-
5
-
6
-
7
-
8
-
9
-
10
-
11
-
12
-
13
-
14
-
15
-
16
-
17
-
18
-
19
-
20
-
21
-
22
-
23
-
24
-
25
-
26
-
27
-
28
-
29
-
30
-
31
-
32
-
33
-
34
-
35
-
36
-
37
-
38
-
39
-
40
-
41
-
42
-
43
-
44
-
45
-
46
-
47
-
48
-
49
-
50
-
51
-
52
-
53
-
54
-
55
-
56
-
57
-
58
-
59
-
60
-
61
-
62
-
63
-
64
-
65
-
66
-
67
-
68
-
69
-
70
-
71
-
72
-
73
-
74
-
75
-
76
-
77
-
78
-
79
-
80
-
81
-
82
-
83
-
84
-
85
-
86
-
87
-
88
-
89
-
90
-
91
-
92
-
93
-
94
-
95
-
96
-
97
-
98
-
99
-
100
-
101
-
102
-
103
-
104
-
105
-
106
-
107
-
108
-
109
-
110
-
111
-
112
-
113
-
114
-
115
-
116
-
117
-
118
-
119
-
120
-
121
-
122
-
123
-
124
-
125
-
126
-
127
-
128
-
129
-
130
-
131
-
132
-
133
-
134
-
135
-
136
-
137
-
138
-
139
-
140
-
141
-
142
-
143
-
144
-
145
-
146
-
147
-
148
-
149
-
150
-
151
-
152
-
153
-
154
-
155
-
156
-
157
-
158
-
159
-
160
-
161
-
162
-
163
-
164
-
165
-
166
-
167
-
168
-
169
-
170
-
171
-
172
-
173
-
174
-
175
-
176
-
177
-
178
-
179
-
180
-
181
-
182
-
183
-
184
-
185
-
186
-
187
-
188
-
189
-
190
-
191
-
192
-
193
-
194
-
195
-
196
-
197
-
198
-
199
-
200
-
201
-
202
-
203
-
204
-
205
-
206
-
207
-
208
-
209
-
210
-
211
-
212
-
213
-
214
-
215
-
216
-
217
-
218
-
219
-
220
-
221
-
222
-
223
-
224
-
225
-
226
-
227
-
228
-
229
-
230
-
231
-
232
-
233
-
234
-
235
-
236
-
237
-
238
-
239
-
240
-
241
-
242
-
243
-
244
-
 245
245 -
 246
246 -
 247
247 -
 248
248 -
 249
249 -
 250
250 -
 251
251 -
 252
252 -
 253
253 -
 254
254 -
 255
255 -
 256
256 -
 257
257 -
 258
258 -
 259
259 -
 260
260 -
 261
261 -
 262
262 -
 263
263 -
 264
264 -
 265
265 -
266
-
267
-
268
-
269
-
270
-
271
-
272
-
273
-
274
-
275
-
276
-
277
-
278
-
279
-
280
-
281
-
282
 |
 |
adidas Group
/
2012 Annual Report
Consolidated Financial Statements
233
2012
/
04.8
/
Notes
/
Notes – Additional Information
Notes – Additional Information
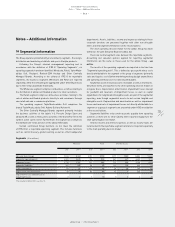
36 Segmental information
The Group operates predominantly in one industry segment – the design,
distribution and marketing of athletic and sports lifestyle products.
Following the Group’s internal management reporting and in
accordance with the definition of IFRS 8 “Operating Segments”, six
operating segments have been identified: Wholesale, Retail, TaylorMade-
adidas Golf, Rockport, Reebok-CCM Hockey and Other Centrally
Managed Brands. According to the criteria of IFRS 8 for reportable
segments, the business segments Wholesale and Retail are reported
separately, while the remaining are aggregated under Other Businesses
due to their only subordinate materiality.
The Wholesale segment comprises all business activities relating to
the distribution of adidas and Reebok products to retail customers.
The Retail segment comprises all business activities relating to the
sale of adidas and Reebok products directly to end consumers through
own retail and own e-commerce platforms.
The operating segment TaylorMade-adidas Golf comprises the
brands TaylorMade, adidas Golf, Adams Golf and Ashworth.
The Other Centrally Managed Brands segment primarily includes
the business activities of the labels Y-3, Porsche Design Sport and
adidas SLVR as well as the business activities of the brand Five Ten in the
outdoor action sports sector. Furthermore, the segment also comprises
the German own-retail activities of the adidas NEO label.
Certain centralised Group functions do not meet the definition
of IFRS 8 for a reportable operating segment. This includes functions
such as central treasury, global sourcing as well as other headquarter
departments. Assets, liabilities, income and expenses relating to these
corporate functions are presented together with other non-allocable
items and intersegment eliminations in the reconciliations.
The chief operating decision maker for the adidas Group has been
defined as the joint Executive Board of adidas AG.
There are no intersegment sales between the reportable segments.
Accounting and valuation policies applied for reporting segmental
information are the same as those used for the adidas Group
/
SEE
NOTE 02.
The results of the operating segments are reported in the line item
”Segmental operating profit”. This is defined as gross profit minus costs
directly attributable to the segment or the group of segments (primarily
sales and logistics costs) before marketing working budget expenditures
and operating overhead costs not directly attributable.
Segmental assets include accounts receivable as well as inventories.
Only these items are reported to the chief operating decision maker on
a regular basis. Depreciation, amortisation, impairment losses (except
for goodwill) and reversals of impairment losses as well as capital
expenditures for tangible and intangible assets are part of the segmental
reporting, even though segmental assets do not contain tangible and
intangible assets. Depreciation and amortisation as well as impairment
losses and reversals of impairment losses not directly attributable to a
segment or a group of segments are presented under HQ/Consolidation
in the reconciliations.
Segmental liabilities only contain accounts payable from operating
activities as there are no other liability items reported regularly to the
chief operating decision maker.
Interest income and interest expenses as well as income taxes are
not allocated to the reportable segments and are not reported separately
to the chief operating decision maker.
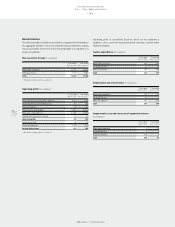
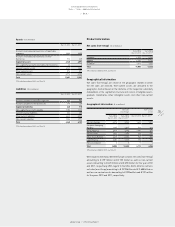
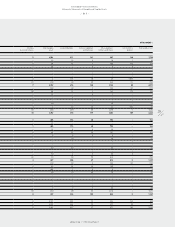
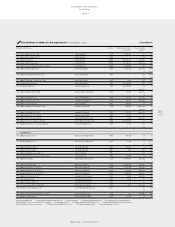
Segments (€ in millions)
Wholesale Retail Other Businesses Total
2012 2011 1) 2012 2011 1) 2012 2011 1) 2012 2011 1)
Net sales (non-Group) 9,533 8,949 3,373 2,793 1,977 1,580 14,883 13,322
Segmental operating profit 2,965 2,690 724 593 541 427 4,230 3,710
Segmental assets 2,715 2,769 721 686 712 638 4,148 4,093
Segmental liabilities 392 525 58 55 190 138 640 718
Capital expenditure 53 62 103 99 28 28 184 189
Depreciation and amortisation 39 25 83 85 11 9 133 119
Impairment losses and reversals of
impairment losses 2 0 1 (1) 0 0 3 (1)
1) Restated according to IAS 8, see Note 03.