Reebok 2012 Annual Report Download - page 154
Download and view the complete annual report
Please find page 154 of the 2012 Reebok annual report below. You can navigate through the pages in the report by either clicking on the pages listed below, or by using the keyword search tool below to find specific information within the annual report.-
 1
1 -
2
-
3
-
4
-
5
-
6
-
7
-
8
-
9
-
10
-
11
-
12
-
13
-
14
-
15
-
16
-
17
-
18
-
19
-
20
-
21
-
22
-
23
-
24
-
25
-
26
-
27
-
28
-
29
-
30
-
31
-
32
-
33
-
34
-
35
-
36
-
37
-
38
-
39
-
40
-
41
-
42
-
43
-
44
-
45
-
46
-
47
-
48
-
49
-
50
-
51
-
52
-
53
-
54
-
55
-
56
-
57
-
58
-
59
-
60
-
61
-
62
-
63
-
64
-
65
-
66
-
67
-
68
-
69
-
70
-
71
-
72
-
73
-
74
-
75
-
76
-
77
-
78
-
79
-
80
-
81
-
82
-
83
-
84
-
85
-
86
-
87
-
88
-
89
-
90
-
91
-
92
-
93
-
94
-
95
-
96
-
97
-
98
-
99
-
100
-
101
-
102
-
103
-
104
-
105
-
106
-
107
-
108
-
109
-
110
-
111
-
112
-
113
-
114
-
115
-
116
-
117
-
118
-
119
-
120
-
121
-
122
-
123
-
124
-
125
-
126
-
127
-
128
-
129
-
130
-
131
-
132
-
133
-
134
-
135
-
136
-
137
-
138
-
139
-
140
-
141
-
142
-
143
-
 144
144 -
 145
145 -
 146
146 -
 147
147 -
 148
148 -
 149
149 -
 150
150 -
 151
151 -
 152
152 -
 153
153 -
 154
154 -
 155
155 -
 156
156 -
 157
157 -
 158
158 -
 159
159 -
 160
160 -
 161
161 -
 162
162 -
 163
163 -
 164
164 -
165
-
166
-
167
-
168
-
169
-
170
-
171
-
172
-
173
-
174
-
175
-
176
-
177
-
178
-
179
-
180
-
181
-
182
-
183
-
184
-
185
-
186
-
187
-
188
-
189
-
190
-
191
-
192
-
193
-
194
-
195
-
196
-
197
-
198
-
199
-
200
-
201
-
202
-
203
-
204
-
205
-
206
-
207
-
208
-
209
-
210
-
211
-
212
-
213
-
214
-
215
-
216
-
217
-
218
-
219
-
220
-
221
-
222
-
223
-
224
-
225
-
226
-
227
-
228
-
229
-
230
-
231
-
232
-
233
-
234
-
235
-
236
-
237
-
238
-
239
-
240
-
241
-
242
-
243
-
244
-
245
-
246
-
247
-
248
-
249
-
250
-
251
-
252
-
253
-
254
-
255
-
256
-
257
-
258
-
259
-
260
-
261
-
262
-
263
-
264
-
265
-
266
-
267
-
268
-
269
-
270
-
271
-
272
-
273
-
274
-
275
-
276
-
277
-
278
-
279
-
280
-
281
-
282
 |
 |
adidas Group
/
2012 Annual Report
Group Management Report – Financial Review
132
2012
/
03.2
/
Group Business Performance
/
Income Statement
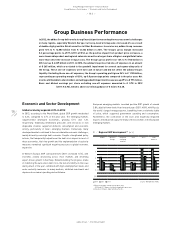
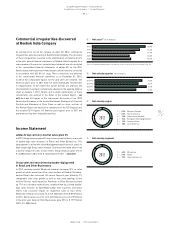
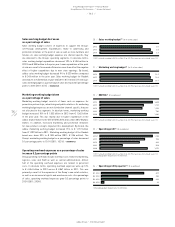
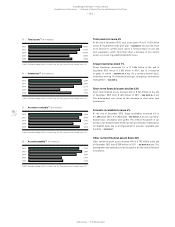
Currency-neutral sales increase in all regions
In 2012, revenues in Western Europe increased 3% on a currency-
neutral basis, primarily as a result of double-digit sales increases in the
UK and Poland. In European Emerging Markets, Group sales increased
15% on a currency-neutral basis due to double-digit growth in most
of the region’s markets, in particular Russia/CIS. Sales for the adidas
Group in North America grew 2% on a currency-neutral basis, with sales
increases in both the USA and Canada. Sales in Greater China increased
15% on a currency-neutral basis. Currency-neutral revenues in Other
Asian Markets grew 7%, driven by strong increases in Japan and South
Korea. In Latin America, sales grew 8% on a currency-neutral basis,
with double-digit increases in most of the region’s major markets, in
particular Argentina. Currency translation effects had a mixed impact on
regional sales in euro terms
/
TABLE 11.
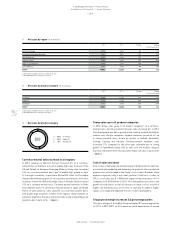
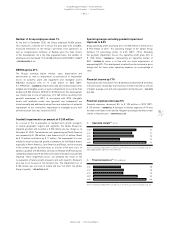
Group sales up in all product categories
In 2012, Group sales grew in all product categories on a currency-
neutral basis. Currency-neutral footwear sales increased 6% in 2012.
This development was due to growth in the running, football, basketball,
outdoor and lifestyle categories. Apparel revenues increased 4% on
a currency-neutral basis, driven by growth in football, basketball,
training, running and lifestyle. Currency-neutral hardware sales
increased 17% compared to the prior year, primarily due to strong
growth at TaylorMade-adidas Golf as well as in the football category.
Currency translation effects had a positive impact on sales in euro terms
/
TABLE 12.
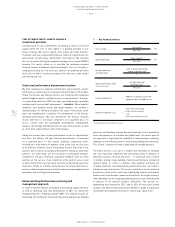
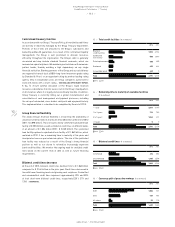
Cost of sales increases
Cost of sales is defined as the amount we pay to third parties for expenses
associated with producing and delivering our products. Own-production
expenses are also included in the Group’s cost of sales. However, these
expenses represent only a very small portion of total cost of sales. In
2012, cost of sales was € 7.780 billion, representing an increase of 11%
compared to € 6.993 billion in 2011. This development was due to the
growth of our business as well as increases in input costs as a result of
higher raw material prices at the time of sourcing. In addition, higher
labour costs negatively impacted the cost of sales development.
Group gross margin increases 0.2 percentage points
The gross margin of the adidas Group increased 0.2 percentage points
to 47.7% in 2012 (2011: 47.5%), above our initial expectations of around
11
/
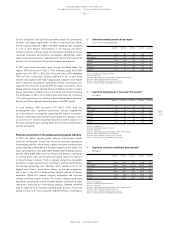
Net sales by region (€ in millions)
2012 2011 1) Change Change
(currency-neutral)
Western Europe 4,076 3,922 4% 3%
European Emerging Markets 1,947 1,597 22% 15%
North America 3,410 3,102 10% 2%
Greater China 1,562 1,229 27% 15%
Other Asian Markets 2,407 2,103 14% 7%
Latin America 1,481 1,369 8% 8%
Total 2) 14,883 13,322 12% 6%
1) Restated according to IAS 8, see Note 03, p. 203.
2) Rounding differences may arise in totals.
12
/
Net sales by product category (€ in millions)
2012 2011 1) Change Change
(currency-neutral)
Footwear 6,922 6,242 11% 6%
Apparel 6,290 5,733 10% 4%
Hardware 1,671 1,347 24% 17%
Total 2) 14,883 13,322 12% 6%
1) Restated according to IAS 8, see Note 03, p. 203.
2) Rounding differences may arise in totals.
13
/
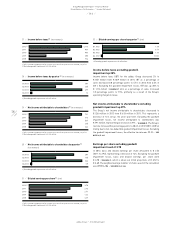
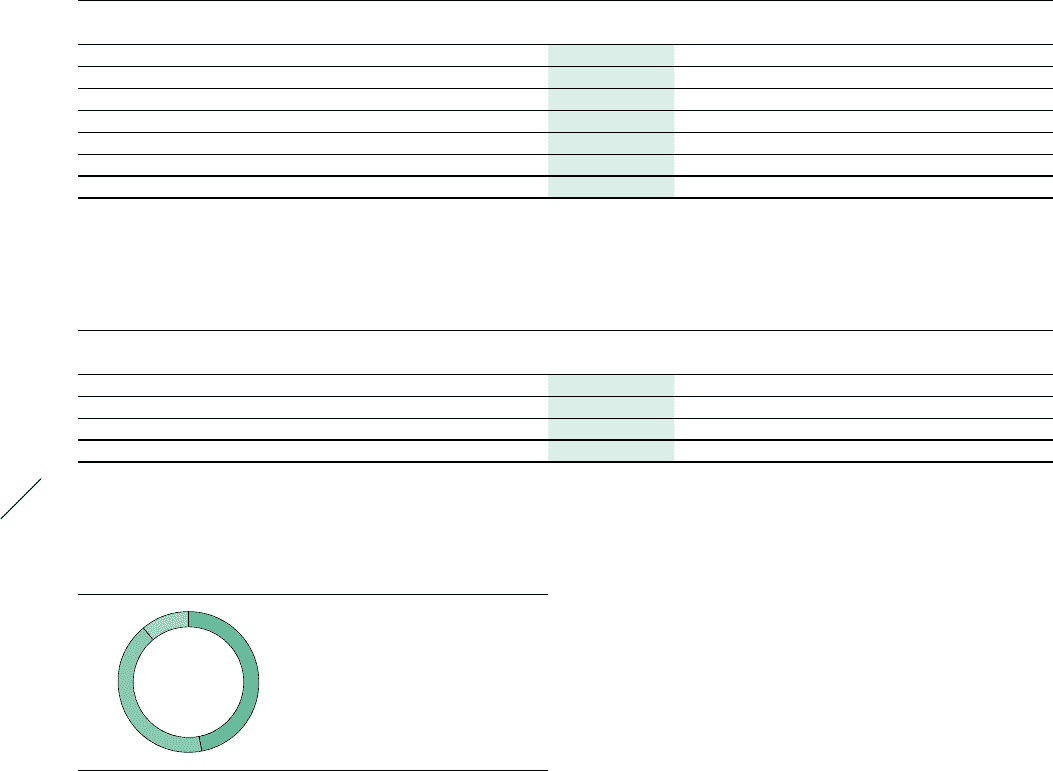
Net sales by product category
2012 1
/
47% Footwear
2
/
42% Apparel
3
/
11% Hardware
1
2
3