Reebok 2012 Annual Report Download - page 149
Download and view the complete annual report
Please find page 149 of the 2012 Reebok annual report below. You can navigate through the pages in the report by either clicking on the pages listed below, or by using the keyword search tool below to find specific information within the annual report.-
 1
1 -
2
-
3
-
4
-
5
-
6
-
7
-
8
-
9
-
10
-
11
-
12
-
13
-
14
-
15
-
16
-
17
-
18
-
19
-
20
-
21
-
22
-
23
-
24
-
25
-
26
-
27
-
28
-
29
-
30
-
31
-
32
-
33
-
34
-
35
-
36
-
37
-
38
-
39
-
40
-
41
-
42
-
43
-
44
-
45
-
46
-
47
-
48
-
49
-
50
-
51
-
52
-
53
-
54
-
55
-
56
-
57
-
58
-
59
-
60
-
61
-
62
-
63
-
64
-
65
-
66
-
67
-
68
-
69
-
70
-
71
-
72
-
73
-
74
-
75
-
76
-
77
-
78
-
79
-
80
-
81
-
82
-
83
-
84
-
85
-
86
-
87
-
88
-
89
-
90
-
91
-
92
-
93
-
94
-
95
-
96
-
97
-
98
-
99
-
100
-
101
-
102
-
103
-
104
-
105
-
106
-
107
-
108
-
109
-
110
-
111
-
112
-
113
-
114
-
115
-
116
-
117
-
118
-
119
-
120
-
121
-
122
-
123
-
124
-
125
-
126
-
127
-
128
-
129
-
130
-
131
-
132
-
133
-
134
-
135
-
136
-
137
-
138
-
 139
139 -
 140
140 -
 141
141 -
 142
142 -
 143
143 -
 144
144 -
 145
145 -
 146
146 -
 147
147 -
 148
148 -
 149
149 -
 150
150 -
 151
151 -
 152
152 -
 153
153 -
 154
154 -
 155
155 -
 156
156 -
 157
157 -
 158
158 -
 159
159 -
160
-
161
-
162
-
163
-
164
-
165
-
166
-
167
-
168
-
169
-
170
-
171
-
172
-
173
-
174
-
175
-
176
-
177
-
178
-
179
-
180
-
181
-
182
-
183
-
184
-
185
-
186
-
187
-
188
-
189
-
190
-
191
-
192
-
193
-
194
-
195
-
196
-
197
-
198
-
199
-
200
-
201
-
202
-
203
-
204
-
205
-
206
-
207
-
208
-
209
-
210
-
211
-
212
-
213
-
214
-
215
-
216
-
217
-
218
-
219
-
220
-
221
-
222
-
223
-
224
-
225
-
226
-
227
-
228
-
229
-
230
-
231
-
232
-
233
-
234
-
235
-
236
-
237
-
238
-
239
-
240
-
241
-
242
-
243
-
244
-
245
-
246
-
247
-
248
-
249
-
250
-
251
-
252
-
253
-
254
-
255
-
256
-
257
-
258
-
259
-
260
-
261
-
262
-
263
-
264
-
265
-
266
-
267
-
268
-
269
-
270
-
271
-
272
-
273
-
274
-
275
-
276
-
277
-
278
-
279
-
280
-
281
-
282
 |
 |

adidas Group
/
2012 Annual Report
Group Management Report – Financial Review
127
2012
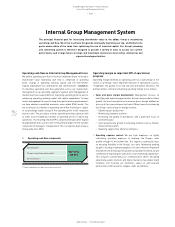
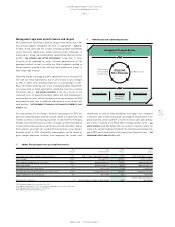
Internal Group Management System
/
03.1
/
Management Business Review
Commercial Executive Team
Operations Review Sales Review
All channels
All markets
Marketing Review
Feedback results
Reconciliation
process led by
Group Finance
Integrated
KPIs + Financials
04
/
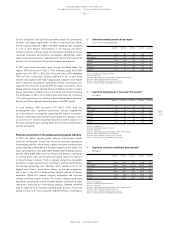
New best practice planning process
03
/
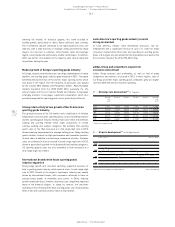
adidas Group targets versus actual key metrics
2011
Actual 1)
2012
Initial outlook 2)
2012
Actual
2013
Targets
Sales (year-over-year change, currency-neutral) 13% mid- to high-single-digit increase 6% mid-single-digit increase
Gross margin 47.5% around 47.5% 47.7% 48.0% to 48.5%
Other operating expenses (in % of sales) 41.8% moderate decline 41.3% moderate decline
Operating margin 7.2% approaching 8.0% 8.0% 3) approaching 9.0%
(Diluted) earnings per share (in €) 2.93 3.52 to 3.68 3.78 3) 4.25 to 4.40
Average operating working capital (in % of net sales) 20.4% moderate increase 20.0% moderate increase
Capital expenditure (€ in millions) 4) 376 400 to 450 434 500 to 550
Net cash (€ in millions) 90 further reduction of gross borrowings 448
further reduction of gross
borrowings
1) Restated according to IAS 8, see Note 03, p. 203.
2) As published on March 7, 2012. The outlook was updated over the course of the year.
3) Excluding goodwill impairment of € 265 million.
4) Excluding acquisitions and finance leases.
Management appraisal of performance and targets
We communicate our Group’s financial targets on an annual basis. We
also provide updates throughout the year as appropriate
/
TABLE 03.
In 2012, Group sales and net income excluding goodwill impairment
losses increased significantly, despite macroeconomic challenges in
many regions. Group sales development outperformed macroeconomic
growth
/
SEE ECONOMIC AND SECTOR DEVELOPMENT, P. 128, due to sales
increases in all geographical areas. Stronger performances in the
emerging markets as well as within our Retail segment resulted in
Group revenues growing in line with our initial guidance of a mid- to
high-single-digit increase.
Operating margin excluding goodwill impairment losses increased in
line with our initial expectations, due to an increase in gross margin
as well as lower other operating expenses as a percentage of sales.
Basic and diluted earnings per share excluding goodwill impairment
losses exceeded our initial expectations, mainly due to positive currency
translation effects
/
SEE INCOME STATEMENT, P. 131. As a result of our
continued focus on operating working capital and cash management,
we exceeded our goals related to balance sheet improvements in 2012
and ended the year with a significant improvement in the Group’s net
cash position
/
SEE STATEMENT OF FINANCIAL POSITION AND STATEMENT OF CASH
FLOWS, P. 137.
Our expectations for the Group’s business performance in 2013 are
based on continued global economic growth, albeit at a lower rate than
in 2012, as well as an increasing proportion of sales from the emerging
markets and controlled space activities. Through our extensive pipeline
of new and innovative products, which have received favourable reviews
from retailers, we project top- and bottom-line increases in our Group’s
financial results in 2013. Profitability improvements will be driven by
gross margin expansion resulting from improving our product and
channel mix as well as lower headwinds from input costs compared
to the prior year. In 2014 and beyond, assuming no deterioration in the
global economy, we are confident to further increase sales and earnings
per share as outlined in our Route 2015 strategic business plan
/
SEE
GROUP STRATEGY, P. 68. We believe that our outlook is realistic within the
scope of the current trading environment. No material event between the
end of 2012 and the publication of this report has altered our view
/
SEE
SUBSEQUENT EVENTS AND OUTLOOK, P. 157.