Reebok 2012 Annual Report Download - page 125
Download and view the complete annual report
Please find page 125 of the 2012 Reebok annual report below. You can navigate through the pages in the report by either clicking on the pages listed below, or by using the keyword search tool below to find specific information within the annual report.-
 1
1 -
2
-
3
-
4
-
5
-
6
-
7
-
8
-
9
-
10
-
11
-
12
-
13
-
14
-
15
-
16
-
17
-
18
-
19
-
20
-
21
-
22
-
23
-
24
-
25
-
26
-
27
-
28
-
29
-
30
-
31
-
32
-
33
-
34
-
35
-
36
-
37
-
38
-
39
-
40
-
41
-
42
-
43
-
44
-
45
-
46
-
47
-
48
-
49
-
50
-
51
-
52
-
53
-
54
-
55
-
56
-
57
-
58
-
59
-
60
-
61
-
62
-
63
-
64
-
65
-
66
-
67
-
68
-
69
-
70
-
71
-
72
-
73
-
74
-
75
-
76
-
77
-
78
-
79
-
80
-
81
-
82
-
83
-
84
-
85
-
86
-
87
-
88
-
89
-
90
-
91
-
92
-
93
-
94
-
95
-
96
-
97
-
98
-
99
-
100
-
101
-
102
-
103
-
104
-
105
-
106
-
107
-
108
-
109
-
110
-
111
-
112
-
113
-
114
-
 115
115 -
 116
116 -
 117
117 -
 118
118 -
 119
119 -
 120
120 -
 121
121 -
 122
122 -
 123
123 -
 124
124 -
 125
125 -
 126
126 -
 127
127 -
 128
128 -
 129
129 -
 130
130 -
 131
131 -
 132
132 -
 133
133 -
 134
134 -
 135
135 -
136
-
137
-
138
-
139
-
140
-
141
-
142
-
143
-
144
-
145
-
146
-
147
-
148
-
149
-
150
-
151
-
152
-
153
-
154
-
155
-
156
-
157
-
158
-
159
-
160
-
161
-
162
-
163
-
164
-
165
-
166
-
167
-
168
-
169
-
170
-
171
-
172
-
173
-
174
-
175
-
176
-
177
-
178
-
179
-
180
-
181
-
182
-
183
-
184
-
185
-
186
-
187
-
188
-
189
-
190
-
191
-
192
-
193
-
194
-
195
-
196
-
197
-
198
-
199
-
200
-
201
-
202
-
203
-
204
-
205
-
206
-
207
-
208
-
209
-
210
-
211
-
212
-
213
-
214
-
215
-
216
-
217
-
218
-
219
-
220
-
221
-
222
-
223
-
224
-
225
-
226
-
227
-
228
-
229
-
230
-
231
-
232
-
233
-
234
-
235
-
236
-
237
-
238
-
239
-
240
-
241
-
242
-
243
-
244
-
245
-
246
-
247
-
248
-
249
-
250
-
251
-
252
-
253
-
254
-
255
-
256
-
257
-
258
-
259
-
260
-
261
-
262
-
263
-
264
-
265
-
266
-
267
-
268
-
269
-
270
-
271
-
272
-
273
-
274
-
275
-
276
-
277
-
278
-
279
-
280
-
281
-
282
 |
 |
adidas Group
/
2012 Annual Report
Group Management Report – Our Group
103
2012
Global Operations
/
02.5
/
03
/
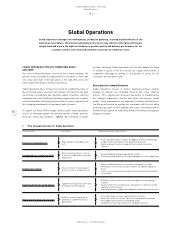
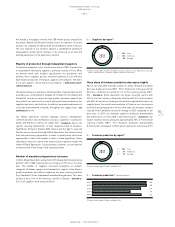
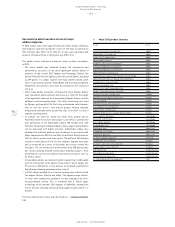
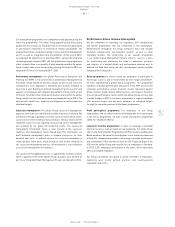
Suppliers by region 1)
1) Figures include adidas, Reebok and adidas Golf, but exclude local sourcing partners, sourcing
agents, subcontractors, second-tier suppliers and licensee factories.
2012 1
/
76% Asia
2
/
16% Americas
3
/
8% Europe
1
2
3
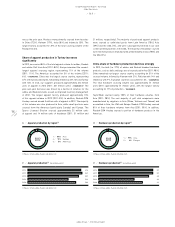
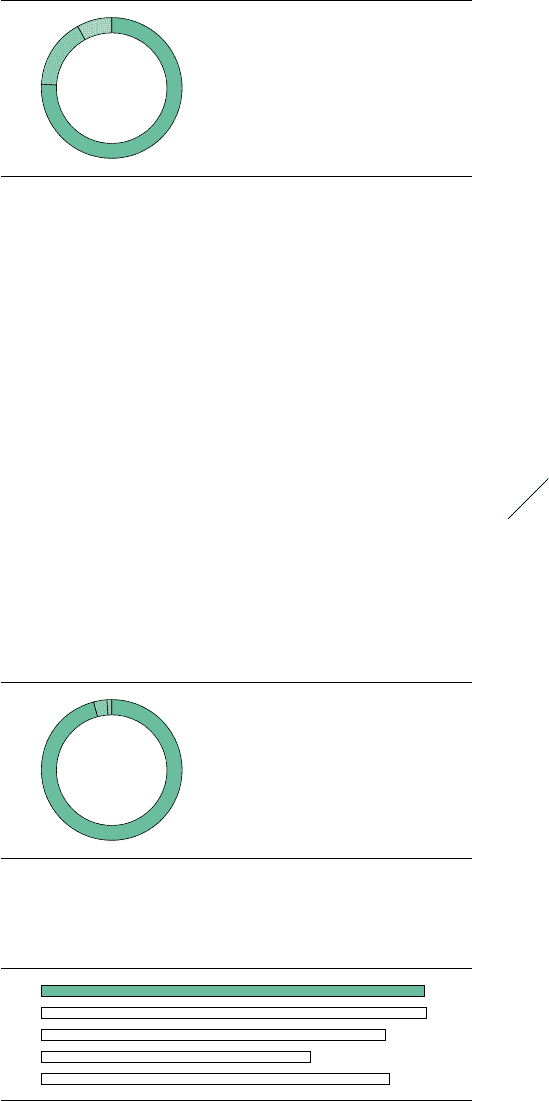
04
/
Footwear production by region 1)
1) Figures include adidas, Reebok and adidas Golf.
2012 1
/
96% Asia
2
/
3% Americas
3
/
1% Europe
1
2 3
will handle a throughput of more than 100 million pieces annually for
the adidas, Reebok and Rockport brands across all channels. A second
facility to be completed in 2013 will be the distribution centre in Russia.
The vast majority of our facilities operate a standardised warehouse
management system which continues to be rolled out to all new and
existing warehouses in the operations network.
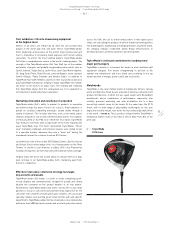
Majority of production through independent suppliers
To minimise production costs, we outsource almost 100% of production
to independent third-party suppliers, primarily located in Asia. While
we provide them with detailed specifications for production and
delivery, these suppliers possess excellent expertise in cost-efficient,
high-volume production of footwear, apparel and hardware. The latest
list of our suppliers can be found on our website :
//
WWW.ADIDAS-GROUP.
COM/SUSTAINABILITY.
The adidas Group also operates a limited number of own production and
assembly sites in Germany (1), Sweden (1), Finland (1), the USA (4) and
Canada (3). In order to ensure the high quality consumers expect from
our products, we enforce strict control and inspection procedures at our
suppliers and in our own factories. In addition, we promote adherence to
social and environmental standards throughout our supply chain
/
SEE
SUSTAINABILITY, P. 117.
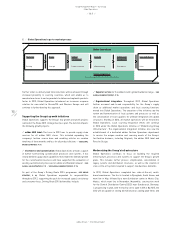
Our Global Operations function manages product development,
commercialisation and distribution, and also supervises sourcing for
adidas and Reebok as well as for adidas Golf
/
DIAGRAM 02. Due to the
specific sourcing requirements in their respective fields of business,
TaylorMade, Rockport, Reebok-CCM Hockey and the Sports Licensed
Division are not serviced through Global Operations, but instead utilise
their own purchasing organisation. In order to quickly seize short-term
opportunities in their local market or react to trade regulations, Group
subsidiaries may also source from selected local suppliers outside the
realm of Global Operations. Local purchases, however, account only for
a minor portion of the Group’s total sourcing volume.
Number of manufacturing partners increases
In 2012, Global Operations worked with 337 independent manufacturing
partners (2011: 308), representing an increase of 29 versus the prior
year. The number of suppliers increased throughout all product
categories (footwear, apparel and hardware) in support of the Group’s
growth aspirations and reflects expansion into new sourcing countries
(e.g. Cambodia). Of our independent manufacturing partners, 76% were
located in Asia, 16% in the Americas and 8% in Europe
/
DIAGRAM 03.
31% of all suppliers were located in China.
China share of footwear production decreases slightly
96% of our total 2012 footwear volume for adidas, Reebok and adidas
Golf was produced in Asia (2011: 97%). Production in Europe and the
Americas combined accounted for 4% of the sourcing volume (2011:
3%)
/
DIAGRAM 04. China represents our largest sourcing country with
33% of the total volume, followed by Vietnam with 31% and Indonesia
with 26%. As part of our strategy to increase the regional diversity of our
supplier base, the overall representation of China in our sourcing mix
declined 2 percentage points. At the same time, the footwear volumes
sourced from Cambodia increased strongly in 2012 compared to the
prior year. In 2012, our footwear suppliers produced approximately
244 million pairs of shoes (2011: 245 million pairs)
/
DIAGRAM 05. Our
largest footwear factory produced approximately 10% of the footwear
sourcing volume (2011: 9%). Rockport produced approximately
8 million pairs of footwear in 2012, which represents a decrease of 5%
05
/
Footwear production 1) (in million pairs)
2012 244
2011 245
2010 219
2009 171
2008 221
1) Figures include adidas, Reebok and adidas Golf.