Reebok 2012 Annual Report Download - page 148
Download and view the complete annual report
Please find page 148 of the 2012 Reebok annual report below. You can navigate through the pages in the report by either clicking on the pages listed below, or by using the keyword search tool below to find specific information within the annual report.-
 1
1 -
2
-
3
-
4
-
5
-
6
-
7
-
8
-
9
-
10
-
11
-
12
-
13
-
14
-
15
-
16
-
17
-
18
-
19
-
20
-
21
-
22
-
23
-
24
-
25
-
26
-
27
-
28
-
29
-
30
-
31
-
32
-
33
-
34
-
35
-
36
-
37
-
38
-
39
-
40
-
41
-
42
-
43
-
44
-
45
-
46
-
47
-
48
-
49
-
50
-
51
-
52
-
53
-
54
-
55
-
56
-
57
-
58
-
59
-
60
-
61
-
62
-
63
-
64
-
65
-
66
-
67
-
68
-
69
-
70
-
71
-
72
-
73
-
74
-
75
-
76
-
77
-
78
-
79
-
80
-
81
-
82
-
83
-
84
-
85
-
86
-
87
-
88
-
89
-
90
-
91
-
92
-
93
-
94
-
95
-
96
-
97
-
98
-
99
-
100
-
101
-
102
-
103
-
104
-
105
-
106
-
107
-
108
-
109
-
110
-
111
-
112
-
113
-
114
-
115
-
116
-
117
-
118
-
119
-
120
-
121
-
122
-
123
-
124
-
125
-
126
-
127
-
128
-
129
-
130
-
131
-
132
-
133
-
134
-
135
-
136
-
137
-
 138
138 -
 139
139 -
 140
140 -
 141
141 -
 142
142 -
 143
143 -
 144
144 -
 145
145 -
 146
146 -
 147
147 -
 148
148 -
 149
149 -
 150
150 -
 151
151 -
 152
152 -
 153
153 -
 154
154 -
 155
155 -
 156
156 -
 157
157 -
 158
158 -
159
-
160
-
161
-
162
-
163
-
164
-
165
-
166
-
167
-
168
-
169
-
170
-
171
-
172
-
173
-
174
-
175
-
176
-
177
-
178
-
179
-
180
-
181
-
182
-
183
-
184
-
185
-
186
-
187
-
188
-
189
-
190
-
191
-
192
-
193
-
194
-
195
-
196
-
197
-
198
-
199
-
200
-
201
-
202
-
203
-
204
-
205
-
206
-
207
-
208
-
209
-
210
-
211
-
212
-
213
-
214
-
215
-
216
-
217
-
218
-
219
-
220
-
221
-
222
-
223
-
224
-
225
-
226
-
227
-
228
-
229
-
230
-
231
-
232
-
233
-
234
-
235
-
236
-
237
-
238
-
239
-
240
-
241
-
242
-
243
-
244
-
245
-
246
-
247
-
248
-
249
-
250
-
251
-
252
-
253
-
254
-
255
-
256
-
257
-
258
-
259
-
260
-
261
-
262
-
263
-
264
-
265
-
266
-
267
-
268
-
269
-
270
-
271
-
272
-
273
-
274
-
275
-
276
-
277
-
278
-
279
-
280
-
281
-
282
 |
 |

adidas Group
/
2012 Annual Report
Group Management Report – Financial Review
126
2012
Internal Group Management System
/
03.1
/
02
/
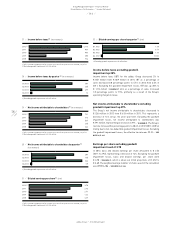
Key financial metrics
1) Excluding acquisitions and finance leases.
processes and timelines of major business functions such as marketing,
sales and operations at a market and global level. The centre-point of
this approach is improving the reliability of future business planning,
leading to a new efficiency level of order book building and conversion.
This, in turn, is expected to lead to improving full-margin business.
The whole process is set up in a rhythm and timeframe to facilitate
full cross-functional alignment and forecasting clarity in advance of
important business decision processes – in particular those related
to product pricing, range building, material purchasing or production
capacity fixing. To create a seamless flow between achieving our
strategic objectives and implementing operational plans, we follow a
rolling two-year time horizon. This ensures more focus on the mid-term
perspective, while at the same time highlighting relevant information
around short-term business events and volatilities. All target-setting is
fully embedded into the integrated planning process and communicated
in advance of all relevant business milestones. The process re-
engineering was finalised in 2012, and in 2013 all necessary system
changes and data restructuring will be initiated to make the approach
sustainable and integrated in all parts of our Group’s value chain.
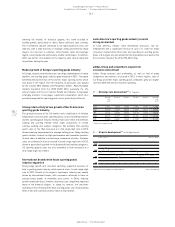
Gross margin Gross profit
= × 100
Net sales
Operating margin Operating profit
= × 100
Net sales
Average operating
working capital
Sum of operating working
capital at quarter-end
=
4
Operating working capital
in % of net sales
Average operating
working capital
= × 100
Net sales
Capital expenditure 1) = Additions of property, plant and
equipment plus intangible assets
Net borrowings/Net cash =
Short-term borrowings
+ long-term borrowings
– cash
– short-term financial assets
Cost of capital metric used to measure
investment potential
Creating value for our shareholders by earning a return on invested
capital above the cost of that capital is a guiding principle of our
Group strategy. We source capital from equity and debt markets.
Therefore, we have a responsibility that our return on capital meets the
expectations of both equity shareholders and creditors. We calculate
the cost of capital utilising the weighted average cost of capital (WACC)
formula. This metric allows us to calculate the minimum required
financial returns of planned capital investments. The cost of equity is
computed utilising the risk-free rate, market risk premium and beta
factor. Cost of debt is calculated using the risk-free rate, credit spread
and average tax rate.
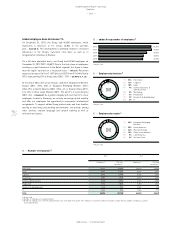
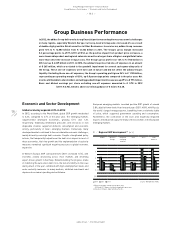
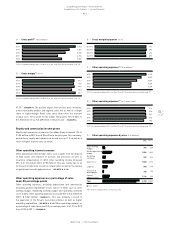
Structured performance measurement system
We have developed an extensive performance measurement system,
which utilises a variety of tools to measure the performance of the adidas
Group. The Group’s key financial metrics are monitored and compared
against budget as well as a rolling forecast on a monthly basis. The focus
is on operating cash flow, CACC, net sales, operating margin, operating
working capital and net debt development
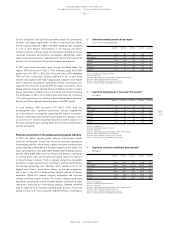
/
DIAGRAM 02. When negative
deviations exist between actual and target numbers, we perform a
detailed analysis to identify and address the cause. If necessary, action
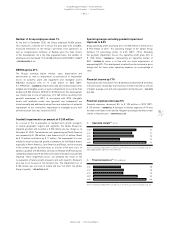
plans are implemented to optimise the development of the Group’s
operating performance. We also benchmark the Group’s financial
results with those of our major competitors on a quarterly basis. To
assess current sales and profitability development, management
analyses sell-through information from our own-retail activities as well
as short-term replenishment orders from retailers.
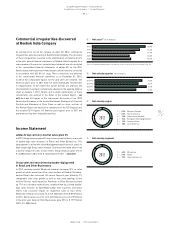
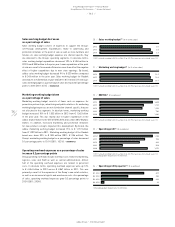
Taking into account year-to-date performance as well as opportunities
and risks, the Group’s full year financial performance is forecasted
on a quarterly basis. In this respect, backlogs comprising orders
received up to nine months in advance of the actual sale are also used
as an indicator. However, due to the growing share of own retail in our
business mix as well as fluctuating order patterns among our wholesale
partners, our order books are less indicative of anticipated revenues
compared to the past. Therefore, qualitative feedback from our retail
partners on the success of our collections at the point of sale as well
as data received from our own-retail activities are becoming even more
important. Finally, as a further early indicator for future performance,
we also conduct market research to better measure brand appeal, brand
awareness and resulting purchase intent.
Enhanced integrated business planning and
management approach
In order to further improve profitability and working capital efficiency
as well as operating cash flow development, in 2011 we started the
Integrated Business Planning initiative (IBP). This initiative focuses on
developing and forming an enhanced forecasting approach by aligning