Reebok 2012 Annual Report Download - page 152
Download and view the complete annual report
Please find page 152 of the 2012 Reebok annual report below. You can navigate through the pages in the report by either clicking on the pages listed below, or by using the keyword search tool below to find specific information within the annual report.-
 1
1 -
2
-
3
-
4
-
5
-
6
-
7
-
8
-
9
-
10
-
11
-
12
-
13
-
14
-
15
-
16
-
17
-
18
-
19
-
20
-
21
-
22
-
23
-
24
-
25
-
26
-
27
-
28
-
29
-
30
-
31
-
32
-
33
-
34
-
35
-
36
-
37
-
38
-
39
-
40
-
41
-
42
-
43
-
44
-
45
-
46
-
47
-
48
-
49
-
50
-
51
-
52
-
53
-
54
-
55
-
56
-
57
-
58
-
59
-
60
-
61
-
62
-
63
-
64
-
65
-
66
-
67
-
68
-
69
-
70
-
71
-
72
-
73
-
74
-
75
-
76
-
77
-
78
-
79
-
80
-
81
-
82
-
83
-
84
-
85
-
86
-
87
-
88
-
89
-
90
-
91
-
92
-
93
-
94
-
95
-
96
-
97
-
98
-
99
-
100
-
101
-
102
-
103
-
104
-
105
-
106
-
107
-
108
-
109
-
110
-
111
-
112
-
113
-
114
-
115
-
116
-
117
-
118
-
119
-
120
-
121
-
122
-
123
-
124
-
125
-
126
-
127
-
128
-
129
-
130
-
131
-
132
-
133
-
134
-
135
-
136
-
137
-
138
-
139
-
140
-
141
-
 142
142 -
 143
143 -
 144
144 -
 145
145 -
 146
146 -
 147
147 -
 148
148 -
 149
149 -
 150
150 -
 151
151 -
 152
152 -
 153
153 -
 154
154 -
 155
155 -
 156
156 -
 157
157 -
 158
158 -
 159
159 -
 160
160 -
 161
161 -
 162
162 -
163
-
164
-
165
-
166
-
167
-
168
-
169
-
170
-
171
-
172
-
173
-
174
-
175
-
176
-
177
-
178
-
179
-
180
-
181
-
182
-
183
-
184
-
185
-
186
-
187
-
188
-
189
-
190
-
191
-
192
-
193
-
194
-
195
-
196
-
197
-
198
-
199
-
200
-
201
-
202
-
203
-
204
-
205
-
206
-
207
-
208
-
209
-
210
-
211
-
212
-
213
-
214
-
215
-
216
-
217
-
218
-
219
-
220
-
221
-
222
-
223
-
224
-
225
-
226
-
227
-
228
-
229
-
230
-
231
-
232
-
233
-
234
-
235
-
236
-
237
-
238
-
239
-
240
-
241
-
242
-
243
-
244
-
245
-
246
-
247
-
248
-
249
-
250
-
251
-
252
-
253
-
254
-
255
-
256
-
257
-
258
-
259
-
260
-
261
-
262
-
263
-
264
-
265
-
266
-
267
-
268
-
269
-
270
-
271
-
272
-
273
-
274
-
275
-
276
-
277
-
278
-
279
-
280
-
281
-
282
 |
 |

adidas Group
/
2012 Annual Report
Group Management Report – Financial Review
130
2012
/
03.2
/
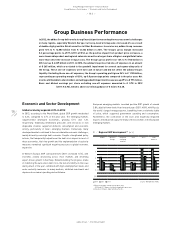
Group Business Performance
/
Economic and Sector Development
entering the market. In technical apparel, this trend resulted in
healthy growth, particularly in shells, fleece and base layer clothing.
The e-commerce channel continued to see rapid expansion across the
industry, with a wide diversity of strategies being presented by many
players on how best to embrace omni-channel retail and leverage
digital, social media and, particularly, mobile technologies. In addition,
2012 saw further consolidation of the industry, with several important
acquisitions during the year.
Modest growth of Europe’s sporting goods industry
In Europe, despite austerity measures and high unemployment in many
markets, the sporting goods industry grew modestly in 2012. The region
benefited directly from two of the world’s major sporting events which
took place in the region. The UK’s industry, in particular, was buoyed
by the London 2012 Olympic and Paralympic Games. Many European
markets benefited from the UEFA EURO 2012, especially the title
winners Spain and the host nations Poland and Ukraine. In European
emerging markets, rising wages supported consumption, which also
positively impacted the sporting goods sector, particularly in Russia.
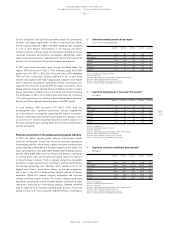
Strong retail activity drives growth of North American
sporting goods industry
The gradual recovery of the US market and a stabilisation of inflation
helped drive solid consumer spending which, in turn, benefited retailers
and the sporting goods industry. Strong retail sales trends in basketball,
training and sporting lifestyle offset slight contractions in certain
running, walking and outdoor categories. We estimate that sporting
goods sales in the USA increased at a mid-single-digit rate in 2012,
driven mainly by improvements in average selling prices. Many sporting
goods retailers focused on high-performance and innovative products
to drive sales, in addition to increasing e-commerce activities. Footwear
sales are estimated to have increased at a mid-single-digit rate in 2012,
driven in particular by growth in the basketball and training categories.
US sporting apparel sales are also estimated to have increased at a
mid-single-digit rate in 2012.
International brands drive Asian sporting goods
industry expansion
Strong wage growth and consumer spending supported increases in
Asia’s sporting goods industry, which grew at a low- to mid-single-digit
rate in 2012. Growth in the region’s sportswear industry was mainly
driven by international brands, with consumers attracted to them as
pseudo-luxury brands at attainable price points. In China, industry
growth remained robust; however, inventory issues negatively impacted
many of the domestic players. In Japan, by contrast, low consumer
spending on discretionary items kept sporting goods sales muted during
2012, in line with overall economic trends in that market.
Latin America’s sporting goods industry records
strong momentum
In Latin America, despite some inflationary pressures, low un-
employment and a significant increase in access to credit for many
consumers helped drive retail sales and spending on sporting goods.
Sales in the region also benefited from the Copa América as well as the
first activities ahead of the 2014 FIFA World Cup.
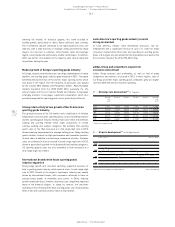
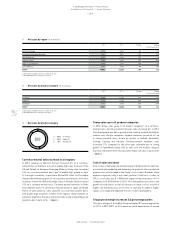
adidas Group and competitors outperform
economic environment
adidas Group revenues and profitability, as well as that of many
competitors and retailers, increased in 2012. In most regions, sales of
our Group and other major sporting goods companies grew at a higher
rate than GDP and overall consumer spending.
06
/
Oil price development 1) (in US $ per barrel)
| Jan. 1, 2011 Dec. 31, 2012 |
120
100
80
60
1) West Texas Intermediate Cushing crude oil. Source: Bloomberg.
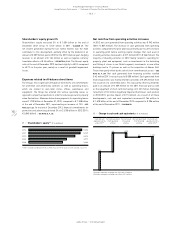
05
/
Exchange rate development 1) (€ 1 equals)
Average
rate
2011
Q1 2012 Q2 2012 Q3 2012 Q4 2012 Average
rate
2012
USD 1.3922 1.3356 1.2590 1.2930 1.3194 1.2862
GBP 0.8678 0.8339 0.8068 0.7981 0.8161 0.8115
JPY 111.04 109.56 100.13 100.37 113.61 102.65
RUB 40.871 39.171 41.316 39.976 40.074 39.951
CNY 9.0000 8.4067 7.9639 8.1989 8.2931 8.1137
1) Spot rates at quarter-end.