Reebok 2012 Annual Report Download - page 156
Download and view the complete annual report
Please find page 156 of the 2012 Reebok annual report below. You can navigate through the pages in the report by either clicking on the pages listed below, or by using the keyword search tool below to find specific information within the annual report.-
 1
1 -
2
-
3
-
4
-
5
-
6
-
7
-
8
-
9
-
10
-
11
-
12
-
13
-
14
-
15
-
16
-
17
-
18
-
19
-
20
-
21
-
22
-
23
-
24
-
25
-
26
-
27
-
28
-
29
-
30
-
31
-
32
-
33
-
34
-
35
-
36
-
37
-
38
-
39
-
40
-
41
-
42
-
43
-
44
-
45
-
46
-
47
-
48
-
49
-
50
-
51
-
52
-
53
-
54
-
55
-
56
-
57
-
58
-
59
-
60
-
61
-
62
-
63
-
64
-
65
-
66
-
67
-
68
-
69
-
70
-
71
-
72
-
73
-
74
-
75
-
76
-
77
-
78
-
79
-
80
-
81
-
82
-
83
-
84
-
85
-
86
-
87
-
88
-
89
-
90
-
91
-
92
-
93
-
94
-
95
-
96
-
97
-
98
-
99
-
100
-
101
-
102
-
103
-
104
-
105
-
106
-
107
-
108
-
109
-
110
-
111
-
112
-
113
-
114
-
115
-
116
-
117
-
118
-
119
-
120
-
121
-
122
-
123
-
124
-
125
-
126
-
127
-
128
-
129
-
130
-
131
-
132
-
133
-
134
-
135
-
136
-
137
-
138
-
139
-
140
-
141
-
142
-
143
-
144
-
145
-
 146
146 -
 147
147 -
 148
148 -
 149
149 -
 150
150 -
 151
151 -
 152
152 -
 153
153 -
 154
154 -
 155
155 -
 156
156 -
 157
157 -
 158
158 -
 159
159 -
 160
160 -
 161
161 -
 162
162 -
 163
163 -
 164
164 -
 165
165 -
 166
166 -
167
-
168
-
169
-
170
-
171
-
172
-
173
-
174
-
175
-
176
-
177
-
178
-
179
-
180
-
181
-
182
-
183
-
184
-
185
-
186
-
187
-
188
-
189
-
190
-
191
-
192
-
193
-
194
-
195
-
196
-
197
-
198
-
199
-
200
-
201
-
202
-
203
-
204
-
205
-
206
-
207
-
208
-
209
-
210
-
211
-
212
-
213
-
214
-
215
-
216
-
217
-
218
-
219
-
220
-
221
-
222
-
223
-
224
-
225
-
226
-
227
-
228
-
229
-
230
-
231
-
232
-
233
-
234
-
235
-
236
-
237
-
238
-
239
-
240
-
241
-
242
-
243
-
244
-
245
-
246
-
247
-
248
-
249
-
250
-
251
-
252
-
253
-
254
-
255
-
256
-
257
-
258
-
259
-
260
-
261
-
262
-
263
-
264
-
265
-
266
-
267
-
268
-
269
-
270
-
271
-
272
-
273
-
274
-
275
-
276
-
277
-
278
-
279
-
280
-
281
-
282
 |
 |
adidas Group
/
2012 Annual Report
Group Management Report – Financial Review
134
2012
/
03.2
/
Group Business Performance
/
Income Statement
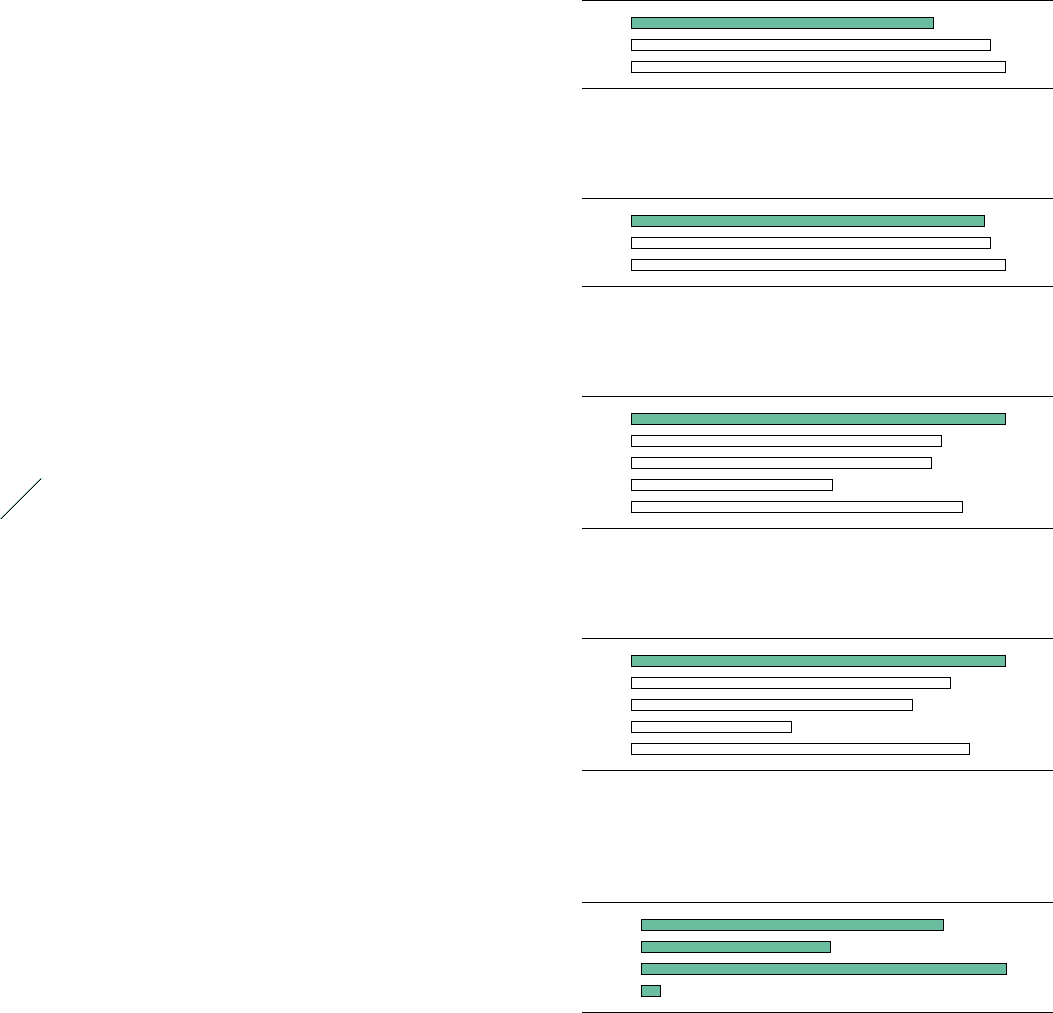
20
/
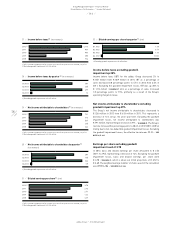
Sales working budget 1) (in % of net sales)
2012 2.0
2011 2.5
2010 2.6
1) 2011 restated according to IAS 8, see Note 03, p. 203. Prior years are not restated, see p. 131.
21
/
Marketing working budget 1) (in % of net sales)
2012 10.1
2011 10.2
2010 10.7
1) 2011 restated according to IAS 8, see Note 03, p. 203. Prior years are not restated, see p. 131.
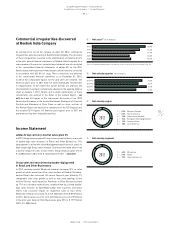
24
/
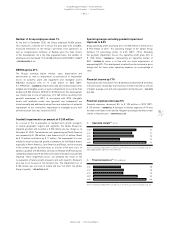
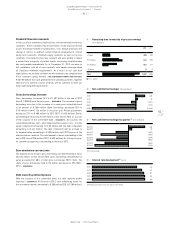
Operating profit by quarter 1) (€ in millions)
Q1 2012 409
Q2 2012 256
Q3 2012 494
Q4 2012 26
1) Excluding goodwill impairment of € 265 million.
22
/
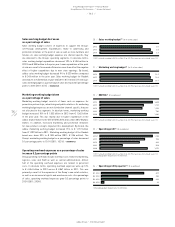
EBITDA 1) (€ in millions)
2012 1,445
2011 1,199
2010 1,159
2009 780
2008 1,280
1) 2011 restated according to IAS 8, see Note 03, p. 203. Prior years are not restated, see p. 131.
23
/
Operating profit 1) (€ in millions)
2012 2) 1,185
2011 953
2010 894
2009 508
2008 1,070
1) 2011 restated according to IAS 8, see Note 03, p. 203. Prior years are not restated, see p. 131.
2) Excluding goodwill impairment of € 265 million.
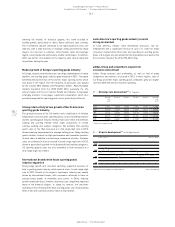
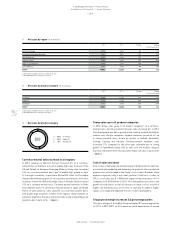
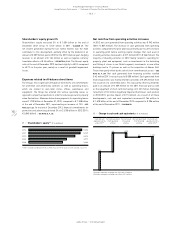
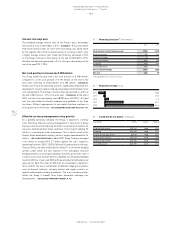
Sales working budget decreases
as a percentage of sales
Sales working budget consists of expenses to support the Group’s
sell-through development. Expenditures relate to advertising and
promotion initiatives at the point of sale as well as store furniture and
fixtures. As sales working budget expenses are channel specific, they
are allocated to the Group’s operating segments. In absolute terms,
sales working budget expenditure decreased 10% to € 304 million in
2012 from € 338 million in the prior year. Lower expenditure at the point
of sale as a result of increased efficiencies more than offset the negative
effect of higher expenditure due to new store openings. By brand,
adidas sales working budget decreased 9% to € 220 million compared
to € 243 million in the prior year. Sales working budget for Reebok
declined 2% to € 50 million at year-end (2011: € 51 million). The Group’s
sales working budget as a percentage of sales decreased 0.5 percentage
points to 2.0% (2011: 2.5%)
/
DIAGRAM 20.
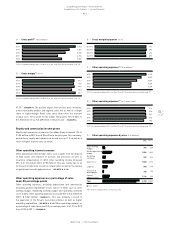
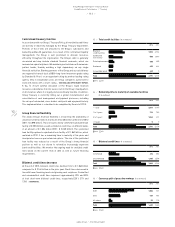
Marketing working budget down
as a percentage of sales
Marketing working budget consists of items such as expenses for
promotion partnerships, advertising and public relations. As marketing
working budget expenses are not distribution channel specific, they are
not allocated to the segments. In absolute terms, marketing working
budget increased 10% to € 1.502 billion in 2012 from € 1.362 billion
in the prior year. This was mainly due to higher expenditure at the
adidas brand related to the UEFA EURO 2012 and London 2012 Olympic
Games. In addition, increased marketing and promotion initiatives
for new product concepts impacted this development. By brand, the
adidas marketing working budget increased 15% to € 1.157 billion
from € 1.007 billion in 2011. Marketing working budget of the Reebok
brand was down 20% to € 188 million (2011: € 236 million). The
Group’s marketing working budget as a percentage of sales decreased
0.1 percentage points to 10.1% (2011: 10.2%)
/
DIAGRAM 21.
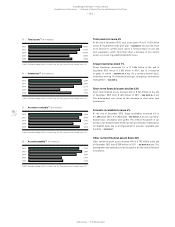
Operating overhead expenses as a percentage of sales
increase 0.2 percentage points
Group operating overheads include overhead costs related to marketing,
logistics, sales and R&D as well as central administration. Almost
half of the operating overhead expenses are related to personnel
costs. In absolute terms, operating overhead expenses were up 12%
to € 4.344 billion in 2012 versus € 3.867 billion in 2011. This was
primarily a result of the expansion of the Group’s own-retail activities,
as well as an increase in logistic and warehouse costs. As a percentage
of sales, operating overhead expenses grew 0.2 percentage points to
29.2% (2011: 29.0%).