Reebok 2012 Annual Report Download - page 199
Download and view the complete annual report
Please find page 199 of the 2012 Reebok annual report below. You can navigate through the pages in the report by either clicking on the pages listed below, or by using the keyword search tool below to find specific information within the annual report.-
 1
1 -
2
-
3
-
4
-
5
-
6
-
7
-
8
-
9
-
10
-
11
-
12
-
13
-
14
-
15
-
16
-
17
-
18
-
19
-
20
-
21
-
22
-
23
-
24
-
25
-
26
-
27
-
28
-
29
-
30
-
31
-
32
-
33
-
34
-
35
-
36
-
37
-
38
-
39
-
40
-
41
-
42
-
43
-
44
-
45
-
46
-
47
-
48
-
49
-
50
-
51
-
52
-
53
-
54
-
55
-
56
-
57
-
58
-
59
-
60
-
61
-
62
-
63
-
64
-
65
-
66
-
67
-
68
-
69
-
70
-
71
-
72
-
73
-
74
-
75
-
76
-
77
-
78
-
79
-
80
-
81
-
82
-
83
-
84
-
85
-
86
-
87
-
88
-
89
-
90
-
91
-
92
-
93
-
94
-
95
-
96
-
97
-
98
-
99
-
100
-
101
-
102
-
103
-
104
-
105
-
106
-
107
-
108
-
109
-
110
-
111
-
112
-
113
-
114
-
115
-
116
-
117
-
118
-
119
-
120
-
121
-
122
-
123
-
124
-
125
-
126
-
127
-
128
-
129
-
130
-
131
-
132
-
133
-
134
-
135
-
136
-
137
-
138
-
139
-
140
-
141
-
142
-
143
-
144
-
145
-
146
-
147
-
148
-
149
-
150
-
151
-
152
-
153
-
154
-
155
-
156
-
157
-
158
-
159
-
160
-
161
-
162
-
163
-
164
-
165
-
166
-
167
-
168
-
169
-
170
-
171
-
172
-
173
-
174
-
175
-
176
-
177
-
178
-
179
-
180
-
181
-
182
-
183
-
184
-
185
-
186
-
187
-
188
-
 189
189 -
 190
190 -
 191
191 -
 192
192 -
 193
193 -
 194
194 -
 195
195 -
 196
196 -
 197
197 -
 198
198 -
 199
199 -
 200
200 -
 201
201 -
 202
202 -
 203
203 -
 204
204 -
 205
205 -
 206
206 -
 207
207 -
 208
208 -
 209
209 -
210
-
211
-
212
-
213
-
214
-
215
-
216
-
217
-
218
-
219
-
220
-
221
-
222
-
223
-
224
-
225
-
226
-
227
-
228
-
229
-
230
-
231
-
232
-
233
-
234
-
235
-
236
-
237
-
238
-
239
-
240
-
241
-
242
-
243
-
244
-
245
-
246
-
247
-
248
-
249
-
250
-
251
-
252
-
253
-
254
-
255
-
256
-
257
-
258
-
259
-
260
-
261
-
262
-
263
-
264
-
265
-
266
-
267
-
268
-
269
-
270
-
271
-
272
-
273
-
274
-
275
-
276
-
277
-
278
-
279
-
280
-
281
-
282
 |
 |

adidas Group
/
2012 Annual Report
Group Management Report – Financial Review
177
2012
/
03.5
/
Risk and Opportunity Report
/
Financial risks
05
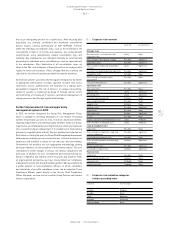
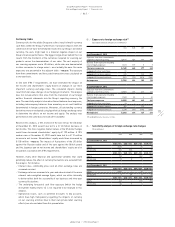
/
Exposure to foreign exchange risk 1)
(based on notional amounts, € in millions)
USD RUB GBP JPY
As at December 31, 2012
Exposure from firm commitments
and forecasted transactions (3,819) 359 369 354
Balance sheet exposure including
intercompany exposure (321) 109 8 8
Total gross exposure (4,140) 468 377 362
Hedged with other cash flows 91
Hedged with currency options 225 (12) (24)
Hedged with forward contracts 2101 (72) (263) (188)
Net exposure (1,723) 396 102 150
As at December 31, 2011
Exposure from firm commitments
and forecasted transactions (3,859) 298 330 331
Balance sheet exposure including
intercompany exposure (140) 83 2 30
Total gross exposure (3,999) 381 332 361
Hedged with other cash flows 93 – – –
Hedged with currency options 365 – (11) –
Hedged with forward contracts 2,298 (47) (194) (145)
Net exposure (1,243) 334 127 216
1) Rounding difference may arise in totals.
06
/
Sensitivity analysis of foreign exchange rate changes
(€ in millions)
USD RUB GBP JPY
As at December 31, 2012
EUR +10% USD +10% EUR +10% EUR +10%
Equity (129) – 20 15
Net income (13) (10) 0 (1)
EUR –10% USD –10% EUR –10% EUR –10%
Equity 158 – (24) (18)
Net income 12 8 0 1
As at December 31, 2011
EUR +10% USD +10% EUR +10% EUR +10%
Equity (195) – 15 11
Net income 5 (9) 0 (3)
EUR –10% USD –10% EUR –10% EUR –10%
Equity 243 – (19) (13)
Net income (6) 7 0 4
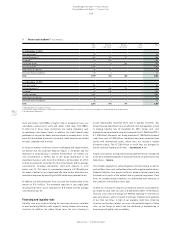
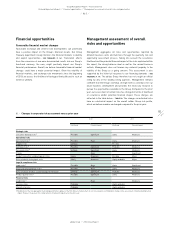
Currency risks
Currency risks for the adidas Group are a direct result of multi-currency
cash flows within the Group. Furthermore, translation impacts from the
conversion of non-euro-denominated results into our Group’s functional
currency, the euro, might lead to a material negative impact on our
Group’s financial performance. The biggest single driver behind this risk
results from the mismatch of the currencies required for sourcing our
products versus the denominations of our sales. The vast majority of
our sourcing expenses are in US dollars, while sales are denominated
in other currencies to a large extent – most notably the euro. Our main
exposures are presented in the adjacent table
/
TABLE 05. The exposure
from firm commitments and forecasted transactions was calculated on
a one-year basis.
In line with IFRS 7 requirements, we have estimated the impact on
net income and shareholders’ equity based on changes in our most
important currency exchange rates. The calculated impacts mainly
result from fair value changes of our hedging instruments. The analysis
does not include effects that arise from the translation of our foreign
entities’ financial statements into the Group’s reporting currency, the
euro. The sensitivity analysis is based on the net balance sheet exposure,
including intercompany balances from monetary assets and liabilities
denominated in foreign currencies. Moreover, all outstanding currency
derivatives were re-evaluated using hypothetical foreign exchange rates
to determine the effects on net income and equity. The analysis was
performed on the same basis for both 2011 and 2012.
Based on this analysis, a 10% increase in the euro versus the US dollar
at December 31, 2012 would have led to a € 13 million decrease in
net income. The more negative market values of the US dollar hedges
would have decreased shareholders’ equity by € 129 million. A 10%
weaker euro at December 31, 2012 would have led to a € 12 million
increase in net income. Shareholders’ equity would have increased by
€ 158 million
/
TABLE 06. The impacts of fluctuations of the US dollar
against the Russian rouble and of the euro against the British pound
and the Japanese yen on net income and shareholders’ equity are also
included in accordance with IFRS requirements.
However, many other financial and operational variables that could
potentially reduce the effect of currency fluctuations are excluded from
the analysis. For instance:
/
Interest rates, commodity prices and all other exchange rates are
assumed constant.
/
Exchange rates are assumed at a year-end value instead of the more
relevant sales-weighted average figure, which we utilise internally
to better reflect both the seasonality of our business and intra-year
currency fluctuations.
/
The underlying forecasted cash flow exposure (which the hedge
instrument mainly relates to) is not required to be revalued in this
analysis.
/
Operational issues, such as potential discounts to key accounts,
which have high transparency regarding the impacts of currency
on our sourcing activities (due to their own private label sourcing
efforts), are also excluded from this presentation.