Reebok 2012 Annual Report Download - page 167
Download and view the complete annual report
Please find page 167 of the 2012 Reebok annual report below. You can navigate through the pages in the report by either clicking on the pages listed below, or by using the keyword search tool below to find specific information within the annual report.-
 1
1 -
2
-
3
-
4
-
5
-
6
-
7
-
8
-
9
-
10
-
11
-
12
-
13
-
14
-
15
-
16
-
17
-
18
-
19
-
20
-
21
-
22
-
23
-
24
-
25
-
26
-
27
-
28
-
29
-
30
-
31
-
32
-
33
-
34
-
35
-
36
-
37
-
38
-
39
-
40
-
41
-
42
-
43
-
44
-
45
-
46
-
47
-
48
-
49
-
50
-
51
-
52
-
53
-
54
-
55
-
56
-
57
-
58
-
59
-
60
-
61
-
62
-
63
-
64
-
65
-
66
-
67
-
68
-
69
-
70
-
71
-
72
-
73
-
74
-
75
-
76
-
77
-
78
-
79
-
80
-
81
-
82
-
83
-
84
-
85
-
86
-
87
-
88
-
89
-
90
-
91
-
92
-
93
-
94
-
95
-
96
-
97
-
98
-
99
-
100
-
101
-
102
-
103
-
104
-
105
-
106
-
107
-
108
-
109
-
110
-
111
-
112
-
113
-
114
-
115
-
116
-
117
-
118
-
119
-
120
-
121
-
122
-
123
-
124
-
125
-
126
-
127
-
128
-
129
-
130
-
131
-
132
-
133
-
134
-
135
-
136
-
137
-
138
-
139
-
140
-
141
-
142
-
143
-
144
-
145
-
146
-
147
-
148
-
149
-
150
-
151
-
152
-
153
-
154
-
155
-
156
-
 157
157 -
 158
158 -
 159
159 -
 160
160 -
 161
161 -
 162
162 -
 163
163 -
 164
164 -
 165
165 -
 166
166 -
 167
167 -
 168
168 -
 169
169 -
 170
170 -
 171
171 -
 172
172 -
 173
173 -
 174
174 -
 175
175 -
 176
176 -
 177
177 -
178
-
179
-
180
-
181
-
182
-
183
-
184
-
185
-
186
-
187
-
188
-
189
-
190
-
191
-
192
-
193
-
194
-
195
-
196
-
197
-
198
-
199
-
200
-
201
-
202
-
203
-
204
-
205
-
206
-
207
-
208
-
209
-
210
-
211
-
212
-
213
-
214
-
215
-
216
-
217
-
218
-
219
-
220
-
221
-
222
-
223
-
224
-
225
-
226
-
227
-
228
-
229
-
230
-
231
-
232
-
233
-
234
-
235
-
236
-
237
-
238
-
239
-
240
-
241
-
242
-
243
-
244
-
245
-
246
-
247
-
248
-
249
-
250
-
251
-
252
-
253
-
254
-
255
-
256
-
257
-
258
-
259
-
260
-
261
-
262
-
263
-
264
-
265
-
266
-
267
-
268
-
269
-
270
-
271
-
272
-
273
-
274
-
275
-
276
-
277
-
278
-
279
-
280
-
281
-
282
 |
 |
adidas Group
/
2012 Annual Report
Group Management Report – Financial Review
145
2012
/
03.2
/
Group Business Performance
/
Financial Statements and Management Report of adidas AG
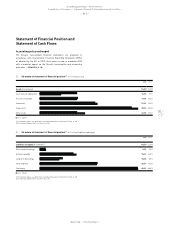
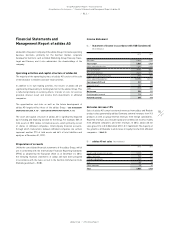
Income Statement
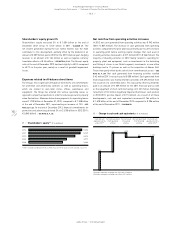
Net sales increase 13%
Sales of adidas AG comprise external revenues from adidas and Reebok
product sales generated by adidas Germany, external revenues from Y-3
products as well as group-internal revenues from foreign subsidiaries.
Reported revenues also include royalty and commission income, mainly
from affiliated companies, and other revenues. In 2012, adidas AG net
sales grew 13% to € 2.004 billion (2011: € 1.766 billion). The majority of
this growth is attributable to an increase in royalty income from affiliated
companies
/
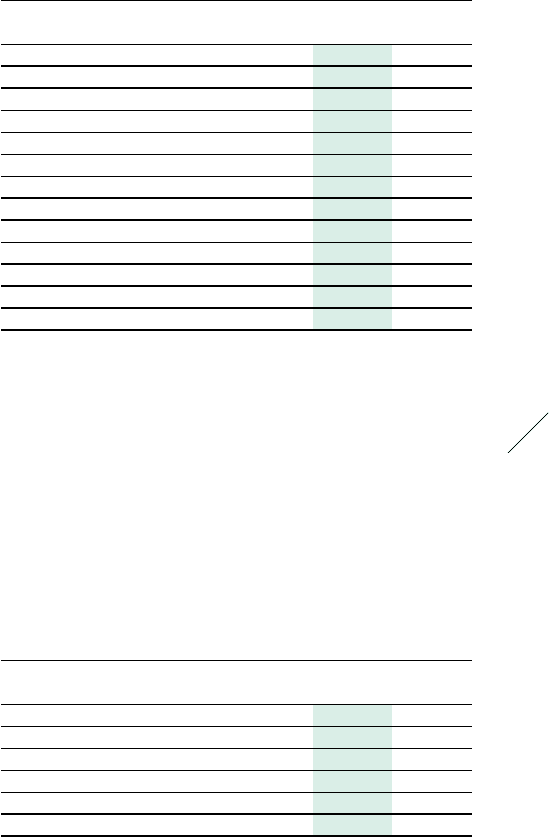
TABLE 55.
54
/
Statement of income in accordance with HGB (Condensed)
(€ in millions)
2012 2011
Net sales 2,004 1,766
Total output 2,004 1,766
Other operating income 1,270 1,254
Cost of materials (574) (531)
Personnel expenses (343) (304)
Depreciation and amortisation (71) (69)
Other operating expenses (2,055) (2,125)
Operating profit/(loss) 231 (9)
Financial result 350 178
Taxes (77) (58)
Net income 504 111
Profit brought forward 103 201
Retained earnings 607 312
Financial Statements and
Management Report of adidas AG
adidas AG is the parent company of the adidas Group. It includes operating
business functions, primarily for the German market, corporate
headquarter functions such as Global Marketing, Group Treasury, Taxes,
Legal and Finance, and it also administers the shareholdings of the
company.
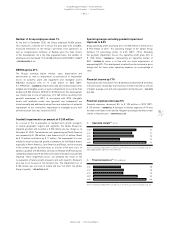
Operating activities and capital structure of adidas AG
The majority of the operating business of adidas AG consists of the sale
of merchandise to retailers and own-retail activities.
In addition to its own trading activities, the results of adidas AG are
significantly influenced by its holding function for the adidas Group. This
is reflected primarily in currency effects, transfer of costs for services
provided, interest result and income from investments in affiliated
companies.
The opportunities and risks as well as the future development of
adidas AG largely reflect those of the adidas Group
/
SEE SUBSEQUENT
EVENTS AND OUTLOOK, P. 157
/
SEE RISK AND OPPORTUNITY REPORT, P. 164.
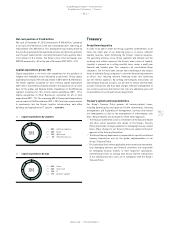
The asset and capital structure of adidas AG is significantly impacted
by its holding and financing function for the Group. For example, 50% of
total assets in 2012 relates to financial assets, which primarily consist
of shares in affiliated companies. Intercompany financial accounts,
through which transactions between affiliated companies are settled,
represent another 27% of total assets and 46% of total liabilities and
equity as at December 31, 2012.
Preparation of accounts
Unlike the consolidated financial statements of the adidas Group, which
are in conformity with the International Financial Reporting Standards
(IFRS), as adopted by the European Union as at December 31, 2012,
the following financial statements of adidas AG have been prepared
in accordance with the rules set out in the German Commercial Code
(Handelsgesetzbuch – HGB).
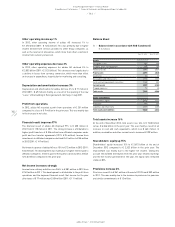
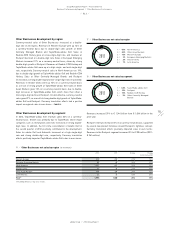
55
/
adidas AG net sales (€ in millions)
2012 2011
Royalty and commission income 1,111 922
adidas Germany 722 672
Foreign subsidiaries 102 113
Y-3 46 39
Other revenues 23 20
Total 2,004 1,766