Reebok 2012 Annual Report Download - page 198
Download and view the complete annual report
Please find page 198 of the 2012 Reebok annual report below. You can navigate through the pages in the report by either clicking on the pages listed below, or by using the keyword search tool below to find specific information within the annual report.-
 1
1 -
2
-
3
-
4
-
5
-
6
-
7
-
8
-
9
-
10
-
11
-
12
-
13
-
14
-
15
-
16
-
17
-
18
-
19
-
20
-
21
-
22
-
23
-
24
-
25
-
26
-
27
-
28
-
29
-
30
-
31
-
32
-
33
-
34
-
35
-
36
-
37
-
38
-
39
-
40
-
41
-
42
-
43
-
44
-
45
-
46
-
47
-
48
-
49
-
50
-
51
-
52
-
53
-
54
-
55
-
56
-
57
-
58
-
59
-
60
-
61
-
62
-
63
-
64
-
65
-
66
-
67
-
68
-
69
-
70
-
71
-
72
-
73
-
74
-
75
-
76
-
77
-
78
-
79
-
80
-
81
-
82
-
83
-
84
-
85
-
86
-
87
-
88
-
89
-
90
-
91
-
92
-
93
-
94
-
95
-
96
-
97
-
98
-
99
-
100
-
101
-
102
-
103
-
104
-
105
-
106
-
107
-
108
-
109
-
110
-
111
-
112
-
113
-
114
-
115
-
116
-
117
-
118
-
119
-
120
-
121
-
122
-
123
-
124
-
125
-
126
-
127
-
128
-
129
-
130
-
131
-
132
-
133
-
134
-
135
-
136
-
137
-
138
-
139
-
140
-
141
-
142
-
143
-
144
-
145
-
146
-
147
-
148
-
149
-
150
-
151
-
152
-
153
-
154
-
155
-
156
-
157
-
158
-
159
-
160
-
161
-
162
-
163
-
164
-
165
-
166
-
167
-
168
-
169
-
170
-
171
-
172
-
173
-
174
-
175
-
176
-
177
-
178
-
179
-
180
-
181
-
182
-
183
-
184
-
185
-
186
-
187
-
 188
188 -
 189
189 -
 190
190 -
 191
191 -
 192
192 -
 193
193 -
 194
194 -
 195
195 -
 196
196 -
 197
197 -
 198
198 -
 199
199 -
 200
200 -
 201
201 -
 202
202 -
 203
203 -
 204
204 -
 205
205 -
 206
206 -
 207
207 -
 208
208 -
209
-
210
-
211
-
212
-
213
-
214
-
215
-
216
-
217
-
218
-
219
-
220
-
221
-
222
-
223
-
224
-
225
-
226
-
227
-
228
-
229
-
230
-
231
-
232
-
233
-
234
-
235
-
236
-
237
-
238
-
239
-
240
-
241
-
242
-
243
-
244
-
245
-
246
-
247
-
248
-
249
-
250
-
251
-
252
-
253
-
254
-
255
-
256
-
257
-
258
-
259
-
260
-
261
-
262
-
263
-
264
-
265
-
266
-
267
-
268
-
269
-
270
-
271
-
272
-
273
-
274
-
275
-
276
-
277
-
278
-
279
-
280
-
281
-
282
 |
 |

adidas Group
/
2012 Annual Report
Group Management Report – Financial Review
176
2012
/
03.5
/
Risk and Opportunity Report
/
Financial risks
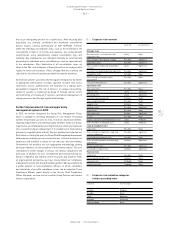
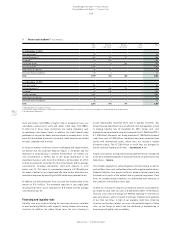
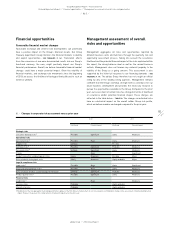
04
/
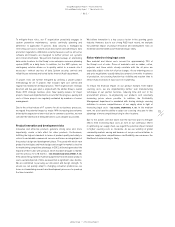
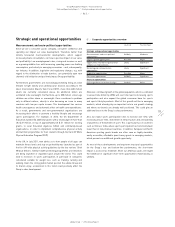
Future cash outflows 1) (€ in millions)
Up to
1 year
Between
1 and 3 years
Between
3 and 5 years
After
5 years
Total
As at December 31, 2012
Bank borrowings 2) 59 – – – 59
Private placements 3) 242 169 117 528
Eurobond 3) 24 514 538
Convertible bond 3) 1 3 503 – 507
Accounts payable 1,790 1,790
Other financial liabilities 26 14 40
Derivative financial liabilities 57 3 60
Total 2,199 703 620 – 3,522
As at December 31, 2011
Bank borrowings 2) 126 – – – 126
Private placements 3) 193 418 119 – 730
Eurobond 3) 24 538 – – 562
Accounts payable 1,887 – – – 1,887
Other financial liabilities 34 7 – – 41
Derivative financial liabilities 32 2 – – 34
Total 2,296 965 119 3,380
1) Rounding difference may arise in totals.
2) Classified as long-term (between 1 and 3 years) in the consolidated financial statements, as they are covered by the committed mid-term syndicated loan.
3) Including interest payments.
work with banks rated BBB+ or higher. Only in exceptional cases are
subsidiaries authorised to work with banks rated lower than BBB+.
To limit risk in these cases, restrictions are clearly stipulated, such
as maximum cash deposit levels. In addition, the credit default swap
premiums of our partner banks are monitored on a weekly basis. In the
event that the defined threshold is exceeded, credit balances are shifted
to banks compliant with the limit.
As financial market conditions remain challenging and highly volatile,
we believe that the potential financial impact is moderate and the
likelihood of materialising is unlikely. Furthermore, we believe our
risk concentration is limited due to the broad distribution of our
investment business with more than 20 banks. At December 31, 2012,
no bank accounted for more than 5% of our investments and the average
concentration, including subsidiaries’ short-term deposits in local
banks, was 1%. This leads to a maximum exposure of € 98 million in
the event of default of any single bank. We have further diversified our
investment exposure by investing into AAA-rated money market funds.
In addition, we held derivatives with a positive fair market value in the
amount of € 61 million. The maximum exposure to any single bank
resulting from these assets amounted to € 8 million and the average
concentration was 5%.
Financing and liquidity risks
Liquidity risks arise from not having the necessary resources available
to meet maturing liabilities with regard to timing, volume and currency
structure. In addition, the adidas Group faces the risk of having to
accept unfavourable financing terms due to liquidity restraints. Our
Group Treasury department uses an efficient cash management system
to manage liquidity risk. At December 31, 2012, Group cash, cash
equivalents and marketable securities amounted to € 1.935 billion (2011:
€ 1.370 billion). Moreover, our Group maintains € 1.863 billion bilateral
credit lines and a € 500 million committed long-term syndicated loan
facility with international banks, which does not include a market
disruption clause. The € 2.363 billion in credit lines are designed to
ensure sufficient liquidity at all times
/
SEE TREASURY, P. 141.
Future cash outflows arising from financial liabilities that are recognised
in the Consolidated Statement of Financial Position are presented in the
table above
/
TABLE 04.
This includes payments to settle obligations from borrowings as well as
cash outflows from cash-settled derivatives with negative market values.
Financial liabilities that may be settled in advance without penalty are
included on the basis of the earliest date of potential repayment. Cash
flows for variable-interest liabilities are determined with reference to
the conditions at the balance sheet date.
In 2012, we continued to improve our financial position substantially as
we ended the year with net cash of € 448 million (2011: € 90 million).
Thus the ratio of net borrowings over EBITDA improved to –0.3 times at
year-end, which is well in line with the Group’s medium-term guideline
of less than two times. In light of our available credit lines, financing
structure and business model, we assess the potential impact of these
risks on the Group as minor and the likelihood of materialising of
financing and liquidity risks as unlikely.