Reebok 2012 Annual Report Download - page 176
Download and view the complete annual report
Please find page 176 of the 2012 Reebok annual report below. You can navigate through the pages in the report by either clicking on the pages listed below, or by using the keyword search tool below to find specific information within the annual report.-
 1
1 -
2
-
3
-
4
-
5
-
6
-
7
-
8
-
9
-
10
-
11
-
12
-
13
-
14
-
15
-
16
-
17
-
18
-
19
-
20
-
21
-
22
-
23
-
24
-
25
-
26
-
27
-
28
-
29
-
30
-
31
-
32
-
33
-
34
-
35
-
36
-
37
-
38
-
39
-
40
-
41
-
42
-
43
-
44
-
45
-
46
-
47
-
48
-
49
-
50
-
51
-
52
-
53
-
54
-
55
-
56
-
57
-
58
-
59
-
60
-
61
-
62
-
63
-
64
-
65
-
66
-
67
-
68
-
69
-
70
-
71
-
72
-
73
-
74
-
75
-
76
-
77
-
78
-
79
-
80
-
81
-
82
-
83
-
84
-
85
-
86
-
87
-
88
-
89
-
90
-
91
-
92
-
93
-
94
-
95
-
96
-
97
-
98
-
99
-
100
-
101
-
102
-
103
-
104
-
105
-
106
-
107
-
108
-
109
-
110
-
111
-
112
-
113
-
114
-
115
-
116
-
117
-
118
-
119
-
120
-
121
-
122
-
123
-
124
-
125
-
126
-
127
-
128
-
129
-
130
-
131
-
132
-
133
-
134
-
135
-
136
-
137
-
138
-
139
-
140
-
141
-
142
-
143
-
144
-
145
-
146
-
147
-
148
-
149
-
150
-
151
-
152
-
153
-
154
-
155
-
156
-
157
-
158
-
159
-
160
-
161
-
162
-
163
-
164
-
165
-
 166
166 -
 167
167 -
 168
168 -
 169
169 -
 170
170 -
 171
171 -
 172
172 -
 173
173 -
 174
174 -
 175
175 -
 176
176 -
 177
177 -
 178
178 -
 179
179 -
 180
180 -
 181
181 -
 182
182 -
 183
183 -
 184
184 -
 185
185 -
 186
186 -
187
-
188
-
189
-
190
-
191
-
192
-
193
-
194
-
195
-
196
-
197
-
198
-
199
-
200
-
201
-
202
-
203
-
204
-
205
-
206
-
207
-
208
-
209
-
210
-
211
-
212
-
213
-
214
-
215
-
216
-
217
-
218
-
219
-
220
-
221
-
222
-
223
-
224
-
225
-
226
-
227
-
228
-
229
-
230
-
231
-
232
-
233
-
234
-
235
-
236
-
237
-
238
-
239
-
240
-
241
-
242
-
243
-
244
-
245
-
246
-
247
-
248
-
249
-
250
-
251
-
252
-
253
-
254
-
255
-
256
-
257
-
258
-
259
-
260
-
261
-
262
-
263
-
264
-
265
-
266
-
267
-
268
-
269
-
270
-
271
-
272
-
273
-
274
-
275
-
276
-
277
-
278
-
279
-
280
-
281
-
282
 |
 |
adidas Group
/
2012 Annual Report
Group Management Report – Financial Review
154
2012
/
03.3
/
Business Performance by Segment
/
Other Businesses Performance
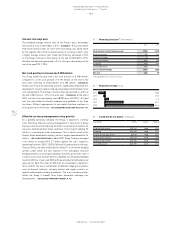
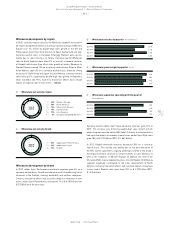
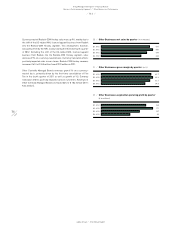
Factory outlet revenues include sales from adidas and Reebok factory
outlets. In 2012, factory outlet revenues grew 9% on a currency-neutral
basis. Sales increased at a double-digit rate at adidas. Reebok sales grew
at a high-single-digit rate. Comparable factory outlet sales increased 7%
on a currency-neutral basis. In 2012, the Group opened 52 and closed
57 factory outlets. In addition, one concept store was reclassified as a
factory outlet. As a result, the number of factory outlets decreased by 4 to
730 at the end of 2012 (December 31, 2011: 734)
/
DIAGRAM 15. Currency
translation effects had a positive impact on sales in euro terms. Factory
outlet sales increased 16% to € 1.528 billion from € 1.321 billion in 2011.
Concession corner revenues include adidas and Reebok concession
corners. In 2012, sales from concession corners increased 7% on a
currency-neutral basis. Sales grew at a high-single-digit rate at adidas
while Reebok sales were up at a low-single-digit rate. Currency-neutral
comparable sales from concession corners grew 6%. In 2012, the Group
opened 21 concession corners and closed 94. In addition, 57 concept
stores were reclassified as concession corners. As a result, the number
of concession corners decreased by 16 to 279 at the end of 2012
(December 31, 2011: 295), of which 182 were related to the adidas brand
and 97 to the Reebok brand
/
DIAGRAM 15. Currency translation effects
had a positive impact on sales in euro terms. Concession corner sales
increased 13% to € 115 million (2011: € 101 million).
eCommerce revenues include e-commerce operations of the adidas and
Reebok brands. In 2012, sales from adidas and Reebok e-commerce
platforms were up 68% on a currency-neutral basis compared to 2011.
Sales increased at strong double-digit rates at both adidas and Reebok.
Currency translation effects had a positive impact on sales in euro terms.
eCommerce revenues grew 78% to € 158 million from € 89 million in
2011.
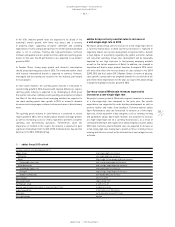
Other Businesses Performance
Other Businesses full year results
In 2012, revenues of Other Businesses grew 17% on a currency-neutral
basis, mainly driven by strong double-digit sales growth at TaylorMade-
adidas Golf as well as at Other Centrally Managed Brands. Sales at
Rockport and Reebok-CCM Hockey also increased. Currency translation
effects positively impacted revenues in euro terms. Sales of Other
Businesses grew 25% to € 1.977 billion (2011: € 1.580 billion)
/
TABLE 16.
Gross margin decreased 0.8 percentage points to 42.8% (2011: 43.5%),
driven by lower product margins at Reebok-CCM Hockey, where
increased sourcing costs as well as the NHL lockout negatively impacted
gross margin development. Other Businesses gross profit was up 23% to
€ 845 million versus € 688 million in 2011
/
TABLE 16.
Segmental operating expenses as a percentage of sales decreased
1.1 percentage points to 15.4% (2011: 16.5%). Segmental operating
expenses in Other Businesses primarily relate to expenditure for sales
force and administration as well as sales working budget expenses
for TaylorMade-adidas Golf, Rockport, Reebok-CCM Hockey and
Other Centrally Managed Brands. In euro terms, segmental operating
expenses rose 17% to € 304 million from € 261 million in 2011. This
was driven in particular by higher expenditure for sales force and
administration at TaylorMade-adidas Golf and Rockport.
Other Businesses segmental operating profit increased 27% to
€ 541 million in 2012 versus € 427 million in the prior year. Segmental
operating margin was up 0.4 percentage points to 27.4% from 27.0%
in 2011
/
TABLE 16. This was the result of lower segmental operating
expenses as a percentage of sales, which more than offset the negative
effects from a lower gross margin.
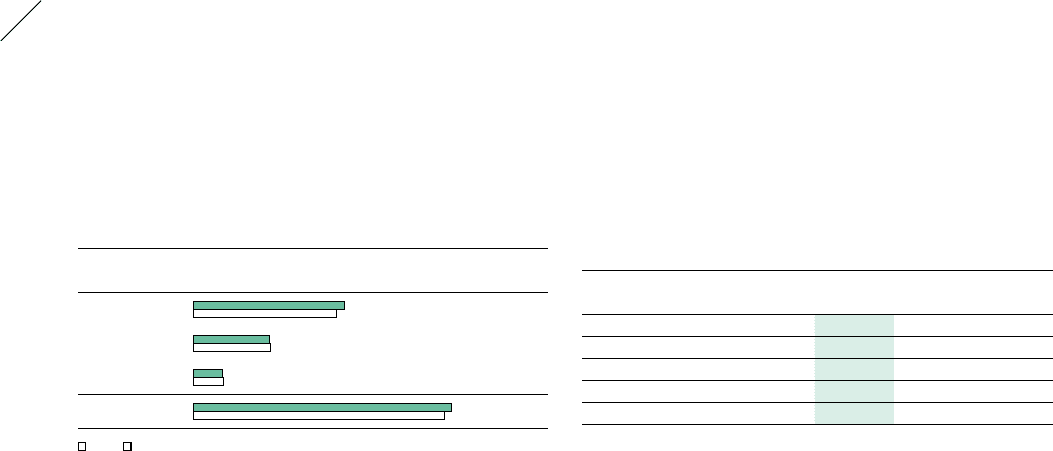
15
/
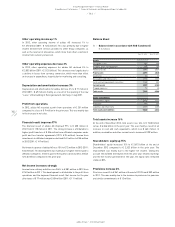
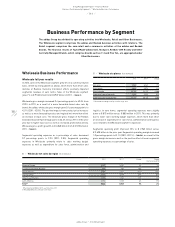
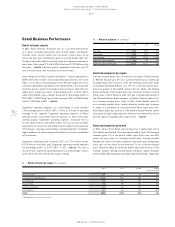
Retail number of stores
2012 2011
Concept stores 1,437 1,355
Factory outlets 730 734
Concession
corners 279 295
Total 2,446 2,384
■ 2012 ■ 2011
16
/
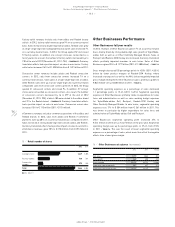
Other Businesses at a glance (€ in millions)
2012 2011 Change
Net sales 1,977 1,580 25%
Gross profit 845 688 23%
Gross margin 42.8% 43.5% (0.8pp)
Segmental operating profit 541 427 27%
Segmental operating margin 27.4% 27.0% 0.4pp