Reebok 2012 Annual Report Download - page 126
Download and view the complete annual report
Please find page 126 of the 2012 Reebok annual report below. You can navigate through the pages in the report by either clicking on the pages listed below, or by using the keyword search tool below to find specific information within the annual report.-
 1
1 -
2
-
3
-
4
-
5
-
6
-
7
-
8
-
9
-
10
-
11
-
12
-
13
-
14
-
15
-
16
-
17
-
18
-
19
-
20
-
21
-
22
-
23
-
24
-
25
-
26
-
27
-
28
-
29
-
30
-
31
-
32
-
33
-
34
-
35
-
36
-
37
-
38
-
39
-
40
-
41
-
42
-
43
-
44
-
45
-
46
-
47
-
48
-
49
-
50
-
51
-
52
-
53
-
54
-
55
-
56
-
57
-
58
-
59
-
60
-
61
-
62
-
63
-
64
-
65
-
66
-
67
-
68
-
69
-
70
-
71
-
72
-
73
-
74
-
75
-
76
-
77
-
78
-
79
-
80
-
81
-
82
-
83
-
84
-
85
-
86
-
87
-
88
-
89
-
90
-
91
-
92
-
93
-
94
-
95
-
96
-
97
-
98
-
99
-
100
-
101
-
102
-
103
-
104
-
105
-
106
-
107
-
108
-
109
-
110
-
111
-
112
-
113
-
114
-
115
-
 116
116 -
 117
117 -
 118
118 -
 119
119 -
 120
120 -
 121
121 -
 122
122 -
 123
123 -
 124
124 -
 125
125 -
 126
126 -
 127
127 -
 128
128 -
 129
129 -
 130
130 -
 131
131 -
 132
132 -
 133
133 -
 134
134 -
 135
135 -
 136
136 -
137
-
138
-
139
-
140
-
141
-
142
-
143
-
144
-
145
-
146
-
147
-
148
-
149
-
150
-
151
-
152
-
153
-
154
-
155
-
156
-
157
-
158
-
159
-
160
-
161
-
162
-
163
-
164
-
165
-
166
-
167
-
168
-
169
-
170
-
171
-
172
-
173
-
174
-
175
-
176
-
177
-
178
-
179
-
180
-
181
-
182
-
183
-
184
-
185
-
186
-
187
-
188
-
189
-
190
-
191
-
192
-
193
-
194
-
195
-
196
-
197
-
198
-
199
-
200
-
201
-
202
-
203
-
204
-
205
-
206
-
207
-
208
-
209
-
210
-
211
-
212
-
213
-
214
-
215
-
216
-
217
-
218
-
219
-
220
-
221
-
222
-
223
-
224
-
225
-
226
-
227
-
228
-
229
-
230
-
231
-
232
-
233
-
234
-
235
-
236
-
237
-
238
-
239
-
240
-
241
-
242
-
243
-
244
-
245
-
246
-
247
-
248
-
249
-
250
-
251
-
252
-
253
-
254
-
255
-
256
-
257
-
258
-
259
-
260
-
261
-
262
-
263
-
264
-
265
-
266
-
267
-
268
-
269
-
270
-
271
-
272
-
273
-
274
-
275
-
276
-
277
-
278
-
279
-
280
-
281
-
282
 |
 |
adidas Group
/
2012 Annual Report
Group Management Report – Our Group
104
2012
Global Operations
/
02.5
/
06
/
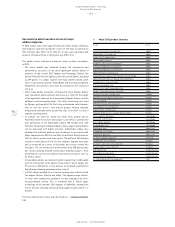
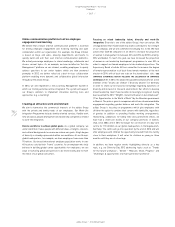
Apparel production by region 1)
1) Figures include adidas, Reebok and adidas Golf.
08
/
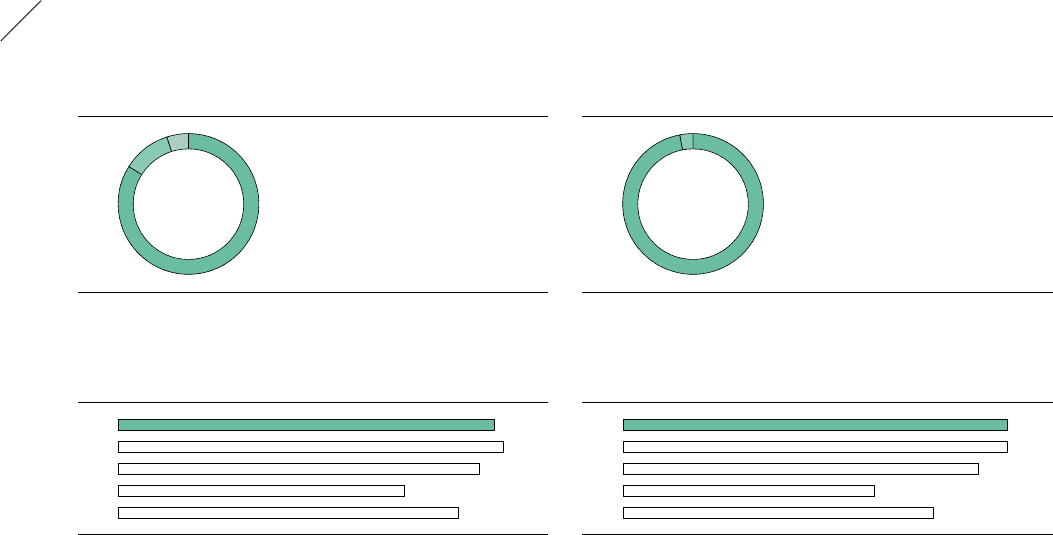
Hardware production by region 1)
1) Figures include adidas, Reebok and adidas Golf.
2012 2012
1
/
84% Asia
2
/
11% Europe
3
/
5% Americas
1
/
97% Asia
2
/
3% Europe
1 1
2 2
3
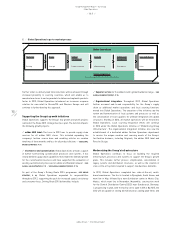
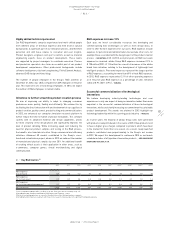
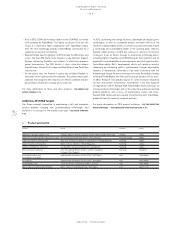
versus the prior year. Products were primarily sourced from factories
in China (72%), Vietnam (17%), India (8%) and Indonesia (3%). The
largest factory accounted for 39% of the total sourcing volume of the
Rockport brand.
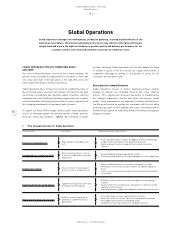
Share of apparel production in Turkey increases
significantly
In 2012, we sourced 84% of the total apparel volume for adidas, Reebok
and adidas Golf from Asia (2011: 83%). Europe remained the second-
largest apparel sourcing region, representing 11% of the volume
(2011: 11%). The Americas accounted for 5% of the volume (2011:
6%)
/
DIAGRAM 06. China was the largest source country, representing
37% of the produced volume, followed by Indonesia with 13% and Turkey
with 10%. In total, our suppliers produced approximately 314 million
units of apparel in 2012 (2011: 321 million units)
/
DIAGRAM 07. The
year-over-year decrease was driven by a decline in volumes for the
adidas and Reebok brands as well as improved inventory management
in 2012. The largest apparel factory produced approximately 10%
of this apparel volume in 2012 (2011: 8%). In addition, Reebok-CCM
Hockey sourced around 3 million units of apparel in 2012. The majority
of this volume was also produced in Asia, while small portions were
sourced from the Americas (particularly Canada) and Europe. The
Sports Licensed Division sourced approximately 25 million units
of apparel and 14 million units of headwear (2011: 31 million and
21 million, respectively). The majority of purchased apparel products
were sourced as unfinished goods from Latin America (70%), Asia
(29%) and the USA (1%), and were subsequently finished in our own
screen-printing facilities in the USA. The majority of headwear sourced
were finished products manufactured predominantly in Asia (98%) and
the USA (2%).
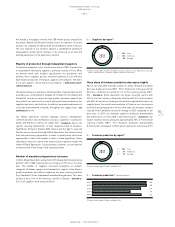
China share of hardware production declines strongly
In 2012, the bulk (i.e. 97%) of adidas and Reebok branded hardware
products, such as balls and bags, was also produced in Asia (2011: 98%).
China remained our largest source country, accounting for 51% of the
sourced volume, followed by Vietnam with 21%, Pakistan with 14% and
Indonesia with 9%. European countries accounted for 3%
/
DIAGRAM 08.
The total hardware sourcing volume was approximately 51 million
units (2011: approximately 51 million units), with the largest factory
accounting for 17% of production
/
DIAGRAM 09.
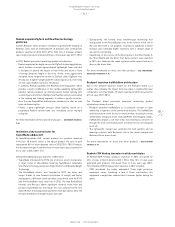
TaylorMade sourced nearly 100% of their hardware volumes from
Asia (2011: 98%). The vast majority of golf club components were
manufactured by suppliers in Asia (China, Vietnam and Taiwan) and
assembled in Asia, the USA and Europe. Reebok-CCM Hockey sourced
81% of their hardware volumes from Asia (2011: 81%). In addition,
Reebok-CCM Hockey sourced a portion of hardware products in the
Americas.
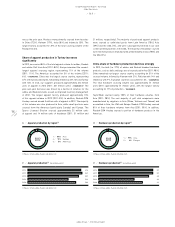
07
/
Apparel production 1) (in million units)
2012 314
2011 321
2010 301
2009 239
2008 284
1) Figures include adidas, Reebok and adidas Golf.
09
/
Hardware production 1) (in million units)
2012 51
2011 51
2010 48
2009 34
2008 42
1) Figures include adidas, Reebok and adidas Golf.