Reebok 2012 Annual Report Download - page 200
Download and view the complete annual report
Please find page 200 of the 2012 Reebok annual report below. You can navigate through the pages in the report by either clicking on the pages listed below, or by using the keyword search tool below to find specific information within the annual report.-
 1
1 -
2
-
3
-
4
-
5
-
6
-
7
-
8
-
9
-
10
-
11
-
12
-
13
-
14
-
15
-
16
-
17
-
18
-
19
-
20
-
21
-
22
-
23
-
24
-
25
-
26
-
27
-
28
-
29
-
30
-
31
-
32
-
33
-
34
-
35
-
36
-
37
-
38
-
39
-
40
-
41
-
42
-
43
-
44
-
45
-
46
-
47
-
48
-
49
-
50
-
51
-
52
-
53
-
54
-
55
-
56
-
57
-
58
-
59
-
60
-
61
-
62
-
63
-
64
-
65
-
66
-
67
-
68
-
69
-
70
-
71
-
72
-
73
-
74
-
75
-
76
-
77
-
78
-
79
-
80
-
81
-
82
-
83
-
84
-
85
-
86
-
87
-
88
-
89
-
90
-
91
-
92
-
93
-
94
-
95
-
96
-
97
-
98
-
99
-
100
-
101
-
102
-
103
-
104
-
105
-
106
-
107
-
108
-
109
-
110
-
111
-
112
-
113
-
114
-
115
-
116
-
117
-
118
-
119
-
120
-
121
-
122
-
123
-
124
-
125
-
126
-
127
-
128
-
129
-
130
-
131
-
132
-
133
-
134
-
135
-
136
-
137
-
138
-
139
-
140
-
141
-
142
-
143
-
144
-
145
-
146
-
147
-
148
-
149
-
150
-
151
-
152
-
153
-
154
-
155
-
156
-
157
-
158
-
159
-
160
-
161
-
162
-
163
-
164
-
165
-
166
-
167
-
168
-
169
-
170
-
171
-
172
-
173
-
174
-
175
-
176
-
177
-
178
-
179
-
180
-
181
-
182
-
183
-
184
-
185
-
186
-
187
-
188
-
189
-
 190
190 -
 191
191 -
 192
192 -
 193
193 -
 194
194 -
 195
195 -
 196
196 -
 197
197 -
 198
198 -
 199
199 -
 200
200 -
 201
201 -
 202
202 -
 203
203 -
 204
204 -
 205
205 -
 206
206 -
 207
207 -
 208
208 -
 209
209 -
 210
210 -
211
-
212
-
213
-
214
-
215
-
216
-
217
-
218
-
219
-
220
-
221
-
222
-
223
-
224
-
225
-
226
-
227
-
228
-
229
-
230
-
231
-
232
-
233
-
234
-
235
-
236
-
237
-
238
-
239
-
240
-
241
-
242
-
243
-
244
-
245
-
246
-
247
-
248
-
249
-
250
-
251
-
252
-
253
-
254
-
255
-
256
-
257
-
258
-
259
-
260
-
261
-
262
-
263
-
264
-
265
-
266
-
267
-
268
-
269
-
270
-
271
-
272
-
273
-
274
-
275
-
276
-
277
-
278
-
279
-
280
-
281
-
282
 |
 |

adidas Group
/
2012 Annual Report
Group Management Report – Financial Review
178
2012
/
03.5
/
Risk and Opportunity Report
/
Financial risks
Utilising a centralised currency risk management system, our Group
hedges currency needs for projected sourcing requirements on a rolling
12- to 24-month basis
/
SEE TREASURY, P. 141. Our goal is to have the vast
majority of our hedging volume secured six months prior to the start
of a given season. In rare instances, hedges are contracted beyond the
24-month horizon. The Group also largely hedges balance sheet risks.
Due to our strong global position, we are able to minimise currency risk
to a large extent by utilising natural hedges.
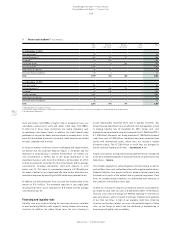
Nevertheless, our gross US dollar cash flow exposure after natural
hedges calculated for 2013 was roughly € 4.0 billion at year-end 2012,
which we hedged using forward contracts, currency options and currency
swaps
/
TABLE 05. Our Group’s Treasury Policy allows us to utilise
hedging instruments, such as currency options or option combinations,
which provide protection from negative exchange rate fluctuations
while – at the same time – retaining the potential to benefit from future
favourable exchange rate developments in the financial markets.
As 2013 hedging has almost been completed, it is clear that conversion
rates on major currencies will be less favourable compared to those of
2012. Volume forecast variances, currency volatility and an increasing
portion of our business in emerging markets will expose the adidas
Group to additional currency risks in 2013. We regard the possible
financial impact of currency risks as major and believe the likelihood of
currency risks is probable.
Interest rate risks
Changes in global market interest rates affect future interest payments
for variable-interest liabilities. As the Group does not have material
variable-interest liabilities, significant interest rate increases should
have only slight adverse effects on the Group’s profitability, liquidity and
financial position.
In line with IFRS 7 requirements, we have analysed the impact of
changes in the Group’s most important interest rates on net income and
shareholders’ equity. The effect of interest rate changes on future cash
flows is excluded from this analysis. Nevertheless, accrued interest,
which is recognised as a liability, has been re-calculated based on
the hypothetical market interest rates as at December 31, 2012. Fair
values for derivative interest rate instruments accounted for as cash
flow hedges were then re-evaluated based on the hypothetical market
interest rates with the resulting effects on net income and equity
included in the sensitivity analysis.
However, the effect on the income statement from changes in the fair
values of hedged items and hedging instruments attributable to interest
rate changes was not material. Exclusions from this analysis are as
follows:
/
Some fixed-rate financial instruments, such as certificates of
deposit, which we value at “fair value through profit or loss” due to
the short-term maturity of these instruments. Potential effects due
to changes in interest rates are considered immaterial and are not
recognised in the sensitivity analysis.
/
Other fixed-rate financial instruments are measured at amortised
cost. Since a change in interest rates would not change the carrying
amount of this category of instruments, there is no net income impact
and they are excluded from this analysis.
The interest rate sensitivity analysis assumes a parallel shift of the
interest yield curve for all currencies and was performed on the same
basis for both 2011 and 2012. A 100 basis point increase in interest
rates at December 31, 2012 would have increased shareholders’ equity
by € 0.00 million (2011: increase by € 0.00 million) and decreased net
income by € 0.00 million (2011: decrease by € 0.07 million). A 100 basis
point decrease of the interest rates at December 31, 2012 would have
resulted in a € 0.00 million decrease in shareholders’ equity (2011:
decrease by € 0.00 million) and a € 0.00 million increase in net income
(2011: increase by € 0.07 million).
We believe the IFRS 7 interest rate analysis represents a realistic, albeit
rough, estimate of our current interest rate risk.
To moderate interest rate risks and maintain financial flexibility, a core
tenet of our Group’s financial strategy is to continue to use surplus cash
flow from operations to reduce gross borrowings
/
SEE TREASURY, P. 141.
Beyond that, the adidas Group is constantly looking for adequate hedging
strategies through interest rate derivatives in order to mitigate interest
rate risks.
In 2012, interest rates in Europe and North America remained at low
levels. Given the central banks’ current interest rate policies and
macro-economic uncertainty, we do not foresee any major interest rate
increases in these regions for the near-term future. Since 97% of the
Group’s financing is in euros and US dollars, we regard the potential
impact of interest rate risks only as minor. Nevertheless, we assess the
likelihood that these risks will materialise as probable.