Reebok 2012 Annual Report Download - page 146
Download and view the complete annual report
Please find page 146 of the 2012 Reebok annual report below. You can navigate through the pages in the report by either clicking on the pages listed below, or by using the keyword search tool below to find specific information within the annual report.-
 1
1 -
2
-
3
-
4
-
5
-
6
-
7
-
8
-
9
-
10
-
11
-
12
-
13
-
14
-
15
-
16
-
17
-
18
-
19
-
20
-
21
-
22
-
23
-
24
-
25
-
26
-
27
-
28
-
29
-
30
-
31
-
32
-
33
-
34
-
35
-
36
-
37
-
38
-
39
-
40
-
41
-
42
-
43
-
44
-
45
-
46
-
47
-
48
-
49
-
50
-
51
-
52
-
53
-
54
-
55
-
56
-
57
-
58
-
59
-
60
-
61
-
62
-
63
-
64
-
65
-
66
-
67
-
68
-
69
-
70
-
71
-
72
-
73
-
74
-
75
-
76
-
77
-
78
-
79
-
80
-
81
-
82
-
83
-
84
-
85
-
86
-
87
-
88
-
89
-
90
-
91
-
92
-
93
-
94
-
95
-
96
-
97
-
98
-
99
-
100
-
101
-
102
-
103
-
104
-
105
-
106
-
107
-
108
-
109
-
110
-
111
-
112
-
113
-
114
-
115
-
116
-
117
-
118
-
119
-
120
-
121
-
122
-
123
-
124
-
125
-
126
-
127
-
128
-
129
-
130
-
131
-
132
-
133
-
134
-
135
-
 136
136 -
 137
137 -
 138
138 -
 139
139 -
 140
140 -
 141
141 -
 142
142 -
 143
143 -
 144
144 -
 145
145 -
 146
146 -
 147
147 -
 148
148 -
 149
149 -
 150
150 -
 151
151 -
 152
152 -
 153
153 -
 154
154 -
 155
155 -
 156
156 -
157
-
158
-
159
-
160
-
161
-
162
-
163
-
164
-
165
-
166
-
167
-
168
-
169
-
170
-
171
-
172
-
173
-
174
-
175
-
176
-
177
-
178
-
179
-
180
-
181
-
182
-
183
-
184
-
185
-
186
-
187
-
188
-
189
-
190
-
191
-
192
-
193
-
194
-
195
-
196
-
197
-
198
-
199
-
200
-
201
-
202
-
203
-
204
-
205
-
206
-
207
-
208
-
209
-
210
-
211
-
212
-
213
-
214
-
215
-
216
-
217
-
218
-
219
-
220
-
221
-
222
-
223
-
224
-
225
-
226
-
227
-
228
-
229
-
230
-
231
-
232
-
233
-
234
-
235
-
236
-
237
-
238
-
239
-
240
-
241
-
242
-
243
-
244
-
245
-
246
-
247
-
248
-
249
-
250
-
251
-
252
-
253
-
254
-
255
-
256
-
257
-
258
-
259
-
260
-
261
-
262
-
263
-
264
-
265
-
266
-
267
-
268
-
269
-
270
-
271
-
272
-
273
-
274
-
275
-
276
-
277
-
278
-
279
-
280
-
281
-
282
 |
 |
1
adidas Group
/
2012 Annual Report
Group Management Report – Financial Review
124
2012
Internal Group Management System
/
03.1
/
Internal Group Management System
The principal financial goal for increasing shareholder value at the adidas Group is maximising
operating cash flow. We strive to achieve this goal by continually improving our top- and bottom-line
performance while at the same time optimising the use of invested capital. Our Group’s planning
and controlling system is therefore designed to provide a variety of tools to assess our current
performance and to align future strategic and investment decisions to best utilise commercial and
organisational opportunities.
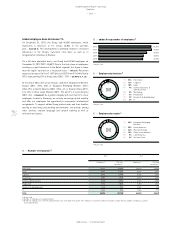
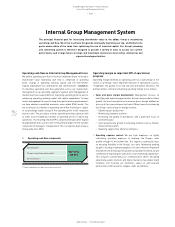
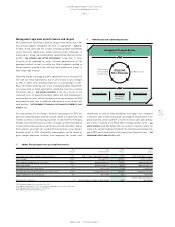
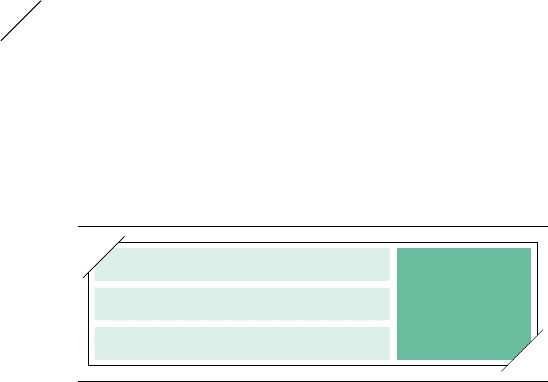
Operating cash flow as Internal Group Management focus
We believe operating cash flow is the most important driver to increase
shareholder value. Operating cash flow is comprised of operating
profit, change in operating working capital and net investments
(capital expenditure less depreciation and amortisation)
/
DIAGRAM 01.
To maximise operating cash flow generation across our organisation,
management of our operating segments together with management at
market level have responsibility for improving operating profit as well as
optimising operating working capital and capital expenditure. To keep
senior management focused on long-term performance improvements,
we have adopted a modified economic value added (EVA) model. The
net asset base of a market or operating unit within the Group is subject
to a percentage capital charge to the operating profit of the respective
business unit. The asset base includes operating working capital as well
as other assets needed by a market or operating unit in its day-to-day
operations. The resulting internal KPI is called Contribution After Capital
Charge (CACC) and is used as one of the primary targets for the variable
component of managers’ compensation. This concept has been in place
Group-wide since 2010.
Operating margin as important KPI of operational
progress
Operating margin (defined as operating profit as a percentage of net
sales) is our Group’s most important measure of operational success.
It highlights the quality of our top line and operational efficiency. The
primary drivers central to enhancing operating margin are as follows:
/
Sales and gross margin development: Management focuses on
identifying and exploiting opportunities that not only provide for future
growth, but also have potential to increase gross margin (defined as
gross profit as a percentage of net sales). Major levers for enhancing
our Group’s sales and gross margin include:
/
Optimising our product mix
/
Minimising clearance activities
/
Increasing the quality of distribution, with a particular focus on
controlled space
/
Over-proportionate growth in emerging markets such as Greater
China and Russia/CIS
/
Realising supply chain efficiency initiatives.
/
Operating expense control: We put high emphasis on tightly
controlling operating expenses to leverage the Group’s sales
growth through to the bottom line. This requires a particular focus
on ensuring flexibility in the Group’s cost base. Marketing working
budget is our largest operating expense. It is one of the most important
mechanisms for driving top-line growth sustainably. Therefore, we are
committed to improving the utilisation of our marketing expenditure.
This includes concentrating our communication efforts (including
advertising, public relations and digital media) on key global brand
initiatives and focusing our promotion spend on well-selected
partnerships with top events, leagues, clubs and athletes.
01
/
Operating cash flow components
Operating profit
Operating
cash flow
Change in operating working capital
Net investments 1)
1) Capital expenditure less depreciation and amortisation.