Reebok 2012 Annual Report Download - page 84
Download and view the complete annual report
Please find page 84 of the 2012 Reebok annual report below. You can navigate through the pages in the report by either clicking on the pages listed below, or by using the keyword search tool below to find specific information within the annual report.-
 1
1 -
2
-
3
-
4
-
5
-
6
-
7
-
8
-
9
-
10
-
11
-
12
-
13
-
14
-
15
-
16
-
17
-
18
-
19
-
20
-
21
-
22
-
23
-
24
-
25
-
26
-
27
-
28
-
29
-
30
-
31
-
32
-
33
-
34
-
35
-
36
-
37
-
38
-
39
-
40
-
41
-
42
-
43
-
44
-
45
-
46
-
47
-
48
-
49
-
50
-
51
-
52
-
53
-
54
-
55
-
56
-
57
-
58
-
59
-
60
-
61
-
62
-
63
-
64
-
65
-
66
-
67
-
68
-
69
-
70
-
71
-
72
-
73
-
 74
74 -
 75
75 -
 76
76 -
 77
77 -
 78
78 -
 79
79 -
 80
80 -
 81
81 -
 82
82 -
 83
83 -
 84
84 -
 85
85 -
 86
86 -
 87
87 -
 88
88 -
 89
89 -
 90
90 -
 91
91 -
 92
92 -
 93
93 -
 94
94 -
95
-
96
-
97
-
98
-
99
-
100
-
101
-
102
-
103
-
104
-
105
-
106
-
107
-
108
-
109
-
110
-
111
-
112
-
113
-
114
-
115
-
116
-
117
-
118
-
119
-
120
-
121
-
122
-
123
-
124
-
125
-
126
-
127
-
128
-
129
-
130
-
131
-
132
-
133
-
134
-
135
-
136
-
137
-
138
-
139
-
140
-
141
-
142
-
143
-
144
-
145
-
146
-
147
-
148
-
149
-
150
-
151
-
152
-
153
-
154
-
155
-
156
-
157
-
158
-
159
-
160
-
161
-
162
-
163
-
164
-
165
-
166
-
167
-
168
-
169
-
170
-
171
-
172
-
173
-
174
-
175
-
176
-
177
-
178
-
179
-
180
-
181
-
182
-
183
-
184
-
185
-
186
-
187
-
188
-
189
-
190
-
191
-
192
-
193
-
194
-
195
-
196
-
197
-
198
-
199
-
200
-
201
-
202
-
203
-
204
-
205
-
206
-
207
-
208
-
209
-
210
-
211
-
212
-
213
-
214
-
215
-
216
-
217
-
218
-
219
-
220
-
221
-
222
-
223
-
224
-
225
-
226
-
227
-
228
-
229
-
230
-
231
-
232
-
233
-
234
-
235
-
236
-
237
-
238
-
239
-
240
-
241
-
242
-
243
-
244
-
245
-
246
-
247
-
248
-
249
-
250
-
251
-
252
-
253
-
254
-
255
-
256
-
257
-
258
-
259
-
260
-
261
-
262
-
263
-
264
-
265
-
266
-
267
-
268
-
269
-
270
-
271
-
272
-
273
-
274
-
275
-
276
-
277
-
278
-
279
-
280
-
281
-
282
 |
 |
adidas Group
/
2012 Annual Report
To Our Shareholders
62
2012
/
01.8
/
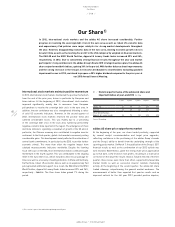
Our Share
05
/
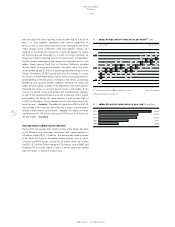
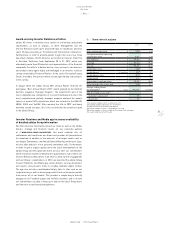
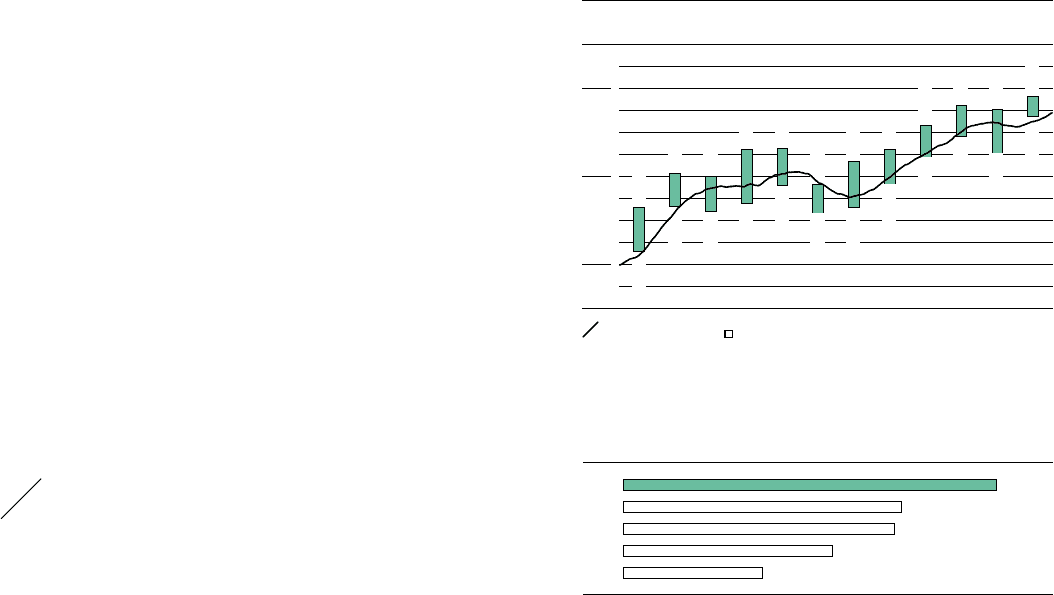
adidas AG market capitalisation at year-end (€ in millions)
2012 14,087
2011 10,515
2010 10,229
2009 7,902
2008 5,252
04
/
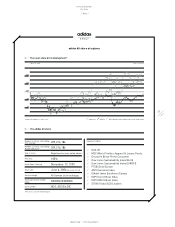
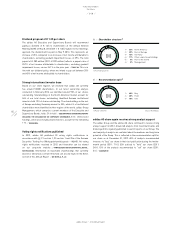
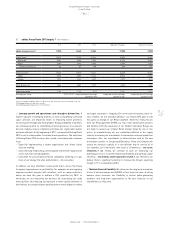
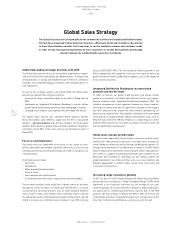
adidas AG high and low share prices per month 1) (in €)
| Jan. 1, 2012 Dec. 31, 2012 |
70
60
50
30-day moving average ■ High and low share prices Source: Bloomberg.
1) Based on daily Xetra closing prices.
56.50
60.34
60.02
63.00
63.16
59.11
61.67
63.07
65.84
68.10
67.62
69.12
51.42
56.51
56.00
56.94
58.90
55.82
56.46
59.10
62.20
64.45
62.61
66.84
with the adidas AG share reaching a new all-time high of € 63.16 on
May 2. In June, negative statements from several competitors in
China as well as worse than expected results released by one of the
adidas Group’s major competitors were key negative catalysts and
weighed on the adidas AG share price. In July and August, the adidas
AG share progressed favourably as a result of positive comments by
market participants regarding our first half year results. In September,
positive analyst commentary and target price upgrades prior to the
adidas Group Investor Field Trip to Carlsbad, California, provided
further stimuli to share price increases. The event, which took place
on September 20 and 21, aimed at delivering additional insight into the
Group’s Generation US 2015 growth plan and the strategy to sustain
the success of TaylorMade-adidas Golf as well as increasing investors’
understanding of the key pillars of Reebok’s new fitness positioning.
Benefiting from positive market feedback following the event, the
adidas AG share gained steadily at the beginning of the fourth quarter.
Following the release of our third quarter results on November 8, the
share price gained strong momentum from mid-November onwards.
In light of the upcoming holiday season and a generally robust market
performance, the adidas AG share reached a new all-time high of
€ 69.12 on December 12 and remained close to this level towards the
end of the year
/
DIAGRAM 04. The adidas AG share closed 2012 at € 67.33,
representing a 34% increase and reflecting a strong outperformance
relative to international stock markets
/
TABLE 01. This implies a market
capitalisation of € 14.1 billion at the end of 2012 versus € 10.5 billion at
the end of 2011
/
DIAGRAM 05.
Average daily trading volume declines
During 2012, the average daily trading volume of the adidas AG share
on all German stock exchanges (excluding bank trades) declined to
0.9 million shares (2011: 1.2 million). The average daily trading volume
of the adidas AG share on alternative trading systems, such as CHI-X,
Turquoise and BATS Europe, declined to 0.5 million shares per trading
day (2011: 0.7 million). Share trading on OTC markets such as BOAT and
EuroNext OTC increased slightly to over 1.1 million shares per trading
day, from under 1.1 million in the prior year.