Reebok 2012 Annual Report Download - page 242
Download and view the complete annual report
Please find page 242 of the 2012 Reebok annual report below. You can navigate through the pages in the report by either clicking on the pages listed below, or by using the keyword search tool below to find specific information within the annual report.-
 1
1 -
2
-
3
-
4
-
5
-
6
-
7
-
8
-
9
-
10
-
11
-
12
-
13
-
14
-
15
-
16
-
17
-
18
-
19
-
20
-
21
-
22
-
23
-
24
-
25
-
26
-
27
-
28
-
29
-
30
-
31
-
32
-
33
-
34
-
35
-
36
-
37
-
38
-
39
-
40
-
41
-
42
-
43
-
44
-
45
-
46
-
47
-
48
-
49
-
50
-
51
-
52
-
53
-
54
-
55
-
56
-
57
-
58
-
59
-
60
-
61
-
62
-
63
-
64
-
65
-
66
-
67
-
68
-
69
-
70
-
71
-
72
-
73
-
74
-
75
-
76
-
77
-
78
-
79
-
80
-
81
-
82
-
83
-
84
-
85
-
86
-
87
-
88
-
89
-
90
-
91
-
92
-
93
-
94
-
95
-
96
-
97
-
98
-
99
-
100
-
101
-
102
-
103
-
104
-
105
-
106
-
107
-
108
-
109
-
110
-
111
-
112
-
113
-
114
-
115
-
116
-
117
-
118
-
119
-
120
-
121
-
122
-
123
-
124
-
125
-
126
-
127
-
128
-
129
-
130
-
131
-
132
-
133
-
134
-
135
-
136
-
137
-
138
-
139
-
140
-
141
-
142
-
143
-
144
-
145
-
146
-
147
-
148
-
149
-
150
-
151
-
152
-
153
-
154
-
155
-
156
-
157
-
158
-
159
-
160
-
161
-
162
-
163
-
164
-
165
-
166
-
167
-
168
-
169
-
170
-
171
-
172
-
173
-
174
-
175
-
176
-
177
-
178
-
179
-
180
-
181
-
182
-
183
-
184
-
185
-
186
-
187
-
188
-
189
-
190
-
191
-
192
-
193
-
194
-
195
-
196
-
197
-
198
-
199
-
200
-
201
-
202
-
203
-
204
-
205
-
206
-
207
-
208
-
209
-
210
-
211
-
212
-
213
-
214
-
215
-
216
-
217
-
218
-
219
-
220
-
221
-
222
-
223
-
224
-
225
-
226
-
227
-
228
-
229
-
230
-
231
-
 232
232 -
 233
233 -
 234
234 -
 235
235 -
 236
236 -
 237
237 -
 238
238 -
 239
239 -
 240
240 -
 241
241 -
 242
242 -
 243
243 -
 244
244 -
 245
245 -
 246
246 -
 247
247 -
 248
248 -
 249
249 -
 250
250 -
 251
251 -
 252
252 -
253
-
254
-
255
-
256
-
257
-
258
-
259
-
260
-
261
-
262
-
263
-
264
-
265
-
266
-
267
-
268
-
269
-
270
-
271
-
272
-
273
-
274
-
275
-
276
-
277
-
278
-
279
-
280
-
281
-
282
 |
 |

adidas Group
/
2012 Annual Report
Consolidated Financial Statements
220
2012
/
04.8
/
Notes
/
Notes to the Consolidated Statement of Financial Position
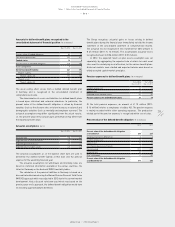
Fair value of plan assets (€ in millions)
2012 2011
Fair value of plan assets at January 1 67 67
Currency translation differences 2 2
Pensions paid (4) (3)
Contributions by the employer 4 4
Contributions paid by plan participants 0 0
Actuarial gain/loss 4 (4)
Expected return on plan assets 3 4
Plan settlements 0 (3)
Fair value of plan assets at December 31 76 67
Around 85% of the plan assets are related to plan assets in the UK,
Germany and Switzerland.
In the UK, the plan assets are held under trust within the pension
fund. In Germany, the plan assets are invested in insurance contracts
and in a pension fund. The plan assets in Switzerland are held by a
pension foundation. In the rest of the world, the plan assets consist
predominantly of insurance contracts.
The expected payments for 2013 amount to € 11 million. Thereof,
€ 7 million relate to benefits paid directly by the Group companies and
€ 4 million to employer contributions paid into the plan assets. In 2012,
the actual return on plan assets was € 7 million (2011: € 0 million).
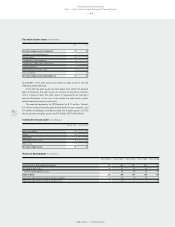
Constitution of plan assets (€ in millions)
Dec. 31, 2012 Dec. 31, 2011
Equity instruments 24 21
Bonds 10 9
Real estate 1 1
Pension plan reinsurance 24 22
Other assets 17 14
Fair value of plan assets 76 67
Historical development (€ in millions)
Dec. 31, 2012 Dec. 31, 2011 Dec. 31, 2010 Dec. 31, 2009 Dec. 31, 2008
Present value of defined benefit obligation 317 260 237 207 172
Fair value of plan assets 76 67 67 61 53
Thereof: defined benefit assets 0 (1) (1) (2) (5)
Deficit in plans 241 194 171 148 124
Experience adjustments arising on the plan liabilities (3) (4) (1) (3) 2
Experience adjustments arising on the plan assets 4 (4) 1 3 (8)