Reebok 2012 Annual Report Download - page 189
Download and view the complete annual report
Please find page 189 of the 2012 Reebok annual report below. You can navigate through the pages in the report by either clicking on the pages listed below, or by using the keyword search tool below to find specific information within the annual report.-
 1
1 -
2
-
3
-
4
-
5
-
6
-
7
-
8
-
9
-
10
-
11
-
12
-
13
-
14
-
15
-
16
-
17
-
18
-
19
-
20
-
21
-
22
-
23
-
24
-
25
-
26
-
27
-
28
-
29
-
30
-
31
-
32
-
33
-
34
-
35
-
36
-
37
-
38
-
39
-
40
-
41
-
42
-
43
-
44
-
45
-
46
-
47
-
48
-
49
-
50
-
51
-
52
-
53
-
54
-
55
-
56
-
57
-
58
-
59
-
60
-
61
-
62
-
63
-
64
-
65
-
66
-
67
-
68
-
69
-
70
-
71
-
72
-
73
-
74
-
75
-
76
-
77
-
78
-
79
-
80
-
81
-
82
-
83
-
84
-
85
-
86
-
87
-
88
-
89
-
90
-
91
-
92
-
93
-
94
-
95
-
96
-
97
-
98
-
99
-
100
-
101
-
102
-
103
-
104
-
105
-
106
-
107
-
108
-
109
-
110
-
111
-
112
-
113
-
114
-
115
-
116
-
117
-
118
-
119
-
120
-
121
-
122
-
123
-
124
-
125
-
126
-
127
-
128
-
129
-
130
-
131
-
132
-
133
-
134
-
135
-
136
-
137
-
138
-
139
-
140
-
141
-
142
-
143
-
144
-
145
-
146
-
147
-
148
-
149
-
150
-
151
-
152
-
153
-
154
-
155
-
156
-
157
-
158
-
159
-
160
-
161
-
162
-
163
-
164
-
165
-
166
-
167
-
168
-
169
-
170
-
171
-
172
-
173
-
174
-
175
-
176
-
177
-
178
-
 179
179 -
 180
180 -
 181
181 -
 182
182 -
 183
183 -
 184
184 -
 185
185 -
 186
186 -
 187
187 -
 188
188 -
 189
189 -
 190
190 -
 191
191 -
 192
192 -
 193
193 -
 194
194 -
 195
195 -
 196
196 -
 197
197 -
 198
198 -
 199
199 -
200
-
201
-
202
-
203
-
204
-
205
-
206
-
207
-
208
-
209
-
210
-
211
-
212
-
213
-
214
-
215
-
216
-
217
-
218
-
219
-
220
-
221
-
222
-
223
-
224
-
225
-
226
-
227
-
228
-
229
-
230
-
231
-
232
-
233
-
234
-
235
-
236
-
237
-
238
-
239
-
240
-
241
-
242
-
243
-
244
-
245
-
246
-
247
-
248
-
249
-
250
-
251
-
252
-
253
-
254
-
255
-
256
-
257
-
258
-
259
-
260
-
261
-
262
-
263
-
264
-
265
-
266
-
267
-
268
-
269
-
270
-
271
-
272
-
273
-
274
-
275
-
276
-
277
-
278
-
279
-
280
-
281
-
282
 |
 |

adidas Group
/
2012 Annual Report
Group Management Report – Financial Review
167
2012
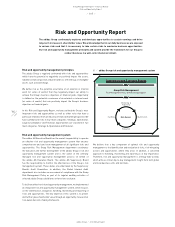
Risk and Opportunity Report
/
03.5
/
03
/
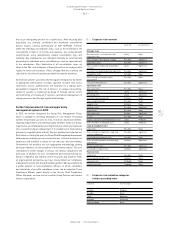
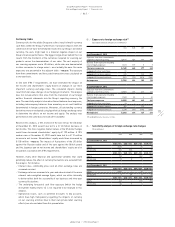
Corporate risk evaluation categories
listed in ascending order
Likelihood Potential impact
Unlikely Marginal
Possible Minor
Likely Moderate
Probable Significant
Highly probable Major
02
/
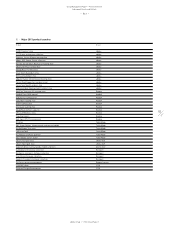
Corporate risk overview
Likelihood Potential impact
Strategic risks
Macroeconomic, socio-political and
regulatory risks
Likely Major
Risks related to distribution strategy Possible Significant
Dependency risks Possible Significant
Risks related to media and stakeholder
activities
Likely Significant
Customer consolidation/private label risks Possible Significant
Competition risks Possible Major
Risks related to risk and control
environment
Possible Major
Consumer demand risks Possible Significant
Operational risks
Own-retail risks Possible Major
Logistics risks Likely Significant
Marketing risks Likely Significant
Customer relationship risks Unlikely Major
Sales and pricing risks Possible Major
Supplier risks Unlikely Major
Inventory risks Possible Significant
Hazard risks Possible Major
Personnel risks Unlikely Significant
IT risks Possible Major
Product innovation and development risks Likely Moderate
Risks related to rising input costs Likely Moderate
Legal & compliance risks
Legal risks Possible Major
Risks related to competition, trade and
customs regulations
Possible Significant
Social and environmental risks Possible Major
Risks related to product counterfeiting
and imitation
Unlikely Significant
Product quality risks Possible Significant
Fraud and corruption risks Unlikely Significant
Financial risks
Credit risks Possible Major
Financing and liquidity risks Unlikely Minor
Currency risks Probable Major
Interest rate risks Probable Minor
that occur infrequently and not on a routine basis. After ensuring data
plausibility, the centrally coordinated and monitored consolidation
process begins, running automatically on SAP SEM-BCS. Controls
within the individual consolidation steps, such as those relating to the
consolidation of debt or of income and expenses, are conducted both
system-based, using automatically created consolidation logs, and
manually. Any inadequacies are remedied manually by systematically
processing the individual errors and differences and are reported back
to the subsidiaries. After finalisation of all consolidation steps, all
items in the P&L and statement of financial position are analysed with
respect to trends and variances. Unless already otherwise clarified, the
subsidiaries are asked to explain any identified material deviations.
All financial systems used are protected against malpractice by means
of appropriate authorisation concepts, approval concepts and access
restrictions. Access authorisations are reviewed on a regular basis
and updated if required. The risk of data loss or outage of accounting-
related IT systems is minimised by Group IT through central control
and monitoring of virtually all IT systems, centralised management of
change processes and through regular data backups.
Further improvement of risk and opportunity
management system in 2012
In 2012, we further sharpened the Group Risk Management Policy,
which is available to all Group employees on our intranet. The policy
outlines the principles, processes, tools, risk areas, key responsibilities,
reporting requirements and communication timelines within our Group.
In particular, we simplified the reporting thresholds, which are now based
only on potential impact independent of the likelihood of materialising
(previously a multiplication of both). We also updated and adjusted our
Risk Universe. During the year, the Group Risk Management department
held numerous training sessions and workshops, to further increase risk
awareness and establish a culture of risk-conscious decision-making.
Furthermore, we modified our risk aggregation methodology, putting
particular emphasis on the evaluation of the potential impact. This also
contributed to visible changes in various risk ratings compared to the
prior year. In addition, we also strengthened and institutionalised our
Group’s compliance and internal control structures and activities. From
an organisational perspective, we have closely linked our compliance
management system with Group Risk Management. We have established
a global network of local Compliance Officers, to whom complaints
and indications of possible compliance issues can be reported. These
Compliance Officers report directly to the Group’s Chief Compliance
Officer. Moreover, we have set up a central Group Policies and Internal
Controls department.