Reebok 2012 Annual Report Download - page 93
Download and view the complete annual report
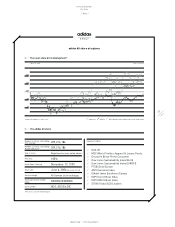
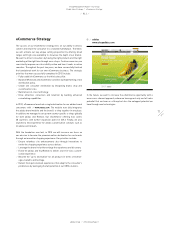
Please find page 93 of the 2012 Reebok annual report below. You can navigate through the pages in the report by either clicking on the pages listed below, or by using the keyword search tool below to find specific information within the annual report.-
 1
1 -
2
-
3
-
4
-
5
-
6
-
7
-
8
-
9
-
10
-
11
-
12
-
13
-
14
-
15
-
16
-
17
-
18
-
19
-
20
-
21
-
22
-
23
-
24
-
25
-
26
-
27
-
28
-
29
-
30
-
31
-
32
-
33
-
34
-
35
-
36
-
37
-
38
-
39
-
40
-
41
-
42
-
43
-
44
-
45
-
46
-
47
-
48
-
49
-
50
-
51
-
52
-
53
-
54
-
55
-
56
-
57
-
58
-
59
-
60
-
61
-
62
-
63
-
64
-
65
-
66
-
67
-
68
-
69
-
70
-
71
-
72
-
73
-
74
-
75
-
76
-
77
-
78
-
79
-
80
-
81
-
82
-
 83
83 -
 84
84 -
 85
85 -
 86
86 -
 87
87 -
 88
88 -
 89
89 -
 90
90 -
 91
91 -
 92
92 -
 93
93 -
 94
94 -
 95
95 -
 96
96 -
 97
97 -
 98
98 -
 99
99 -
 100
100 -
 101
101 -
 102
102 -
 103
103 -
104
-
105
-
106
-
107
-
108
-
109
-
110
-
111
-
112
-
113
-
114
-
115
-
116
-
117
-
118
-
119
-
120
-
121
-
122
-
123
-
124
-
125
-
126
-
127
-
128
-
129
-
130
-
131
-
132
-
133
-
134
-
135
-
136
-
137
-
138
-
139
-
140
-
141
-
142
-
143
-
144
-
145
-
146
-
147
-
148
-
149
-
150
-
151
-
152
-
153
-
154
-
155
-
156
-
157
-
158
-
159
-
160
-
161
-
162
-
163
-
164
-
165
-
166
-
167
-
168
-
169
-
170
-
171
-
172
-
173
-
174
-
175
-
176
-
177
-
178
-
179
-
180
-
181
-
182
-
183
-
184
-
185
-
186
-
187
-
188
-
189
-
190
-
191
-
192
-
193
-
194
-
195
-
196
-
197
-
198
-
199
-
200
-
201
-
202
-
203
-
204
-
205
-
206
-
207
-
208
-
209
-
210
-
211
-
212
-
213
-
214
-
215
-
216
-
217
-
218
-
219
-
220
-
221
-
222
-
223
-
224
-
225
-
226
-
227
-
228
-
229
-
230
-
231
-
232
-
233
-
234
-
235
-
236
-
237
-
238
-
239
-
240
-
241
-
242
-
243
-
244
-
245
-
246
-
247
-
248
-
249
-
250
-
251
-
252
-
253
-
254
-
255
-
256
-
257
-
258
-
259
-
260
-
261
-
262
-
263
-
264
-
265
-
266
-
267
-
268
-
269
-
270
-
271
-
272
-
273
-
274
-
275
-
276
-
277
-
278
-
279
-
280
-
281
-
282
 |
 |
adidas Group
/
2012 Annual Report
Group Management Report – Our Group
71
2012
Group Strategy
/
02.1
/
/
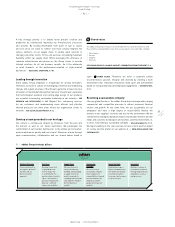
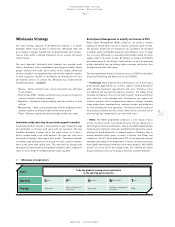
Leverage growth and operational scale through to bottom line: A
higher exposure to emerging markets as well as expanding controlled
space activities are important levers to improving brand presence,
increasing sell-through and driving higher Group profitability. In addition,
we continuously work on streamlining internal processes to accelerate
decision-making, reduce complexity and make our organisation leaner
and more efficient. At the beginning of 2011, we launched Driving Route
2015 to act as a key enabler to achieve these aspirations. The objectives
of Driving Route 2015 are very clear: speed, consistency and consumer
focus.
/
Speed by implementing a leaner organisation that allows faster
decision-making.
/
Consistency by establishing a more aligned and efficient organisation
across functions and geographies.
/
Consumer focus by reducing internal complexity, enabling us to put
more of our energy into what really matters – the consumer.
In addition, we have identified several profit levers across the Group
to support improvements in profitability. For example, we are targeting
improved product margins with initiatives such as range reduction,
where we have the goal to achieve a 25% reduction by 2015. In
wholesale, we are improving our business by sharpening our trade
terms policies and reducing our exposure to lower-quality channels of
distribution, focusing on higher-quality partners more aligned to where
our target consumer is shopping. On our mission to become a best-in-
class retailer, we are already halfway to our Route 2015 goal to add
five points of margin in our Retail segment. Given the strong results
from our HR programme SHINE, our real estate optimisation projects
and benefits from the expansion of our Global Foundation Range, we
are likely to exceed our original Retail margin target by one or two
points. In manufacturing, we are combatting inflation in the supply
chain by increasing our investments in automation and new production
techniques. Also, our investments in infrastructure such as the new
distribution centres in Osnabrueck/Germany, China and Canada will
ensure we increase capacity in a cost-efficient way to service all of
our channels, be it wholesale, own retail or eCommerce
/
SEE GLOBAL
OPERATIONS, P. 100. Finally, we continue to work on enhancing our
planning processes, to further improve profitability and working capital
efficiency
/
SEE INTERNAL GROUP MANAGEMENT SYSTEM, P. 124. Therefore, we
believe there is significant potential to increase the Group’s operating
margin to 11% sustainably by 2015.
/
Maintain financial flexibility: We strive over the long term to maintain
a ratio of net borrowings over EBITDA of less than two times. A strong
balance sheet increases our flexibility to realise value-generating
medium- and long-term opportunities in the best interests of our
shareholders as they arise.
02
/
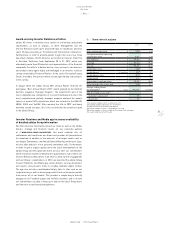
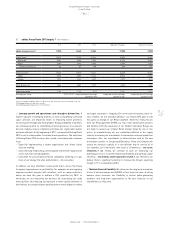
adidas Group Route 2015 targets 1) (€ in millions)
2010 2011 2012 Updated 2015 targets Original 2015 targets
adidas Group net sales 2) 11,990 13,322 14,883 17,000 17,000
Global Sales 2) 10,570 11,742 12,906 14,800 15,200
Wholesale 8,181 8,949 9,533 10,200 10,600
Retail 2,389 2,793 3,373 4,600 4,600
thereof eCommerce 55 89 158 500 500
Global Brands 2) 10,627 11,807 13,011 14,800 15,200
adidas 8,714 9,867 11,344 12,800 12,200
Reebok 1,913 1,940 1,667 2,000 3,000
Other Businesses 1,420 1,580 1,977 2,200 1,800
Operating margin 7.5% 7.2% 8% 3) 11.0% 11.0%
Earnings per share 2010 – 2012 3): compound annual earnings
growth of 18%
compound annual earnings
growth of 15%
compound annual earnings
growth of 15%
1) 2011 restated according to IAS 8, see Note 03, p. 203. Prior years are not restated, see p. 131.
2) Rounding differences may arise in totals.
3) Excluding goodwill impairment of € 265 million.