Reebok 2012 Annual Report Download - page 160
Download and view the complete annual report
Please find page 160 of the 2012 Reebok annual report below. You can navigate through the pages in the report by either clicking on the pages listed below, or by using the keyword search tool below to find specific information within the annual report.-
 1
1 -
2
-
3
-
4
-
5
-
6
-
7
-
8
-
9
-
10
-
11
-
12
-
13
-
14
-
15
-
16
-
17
-
18
-
19
-
20
-
21
-
22
-
23
-
24
-
25
-
26
-
27
-
28
-
29
-
30
-
31
-
32
-
33
-
34
-
35
-
36
-
37
-
38
-
39
-
40
-
41
-
42
-
43
-
44
-
45
-
46
-
47
-
48
-
49
-
50
-
51
-
52
-
53
-
54
-
55
-
56
-
57
-
58
-
59
-
60
-
61
-
62
-
63
-
64
-
65
-
66
-
67
-
68
-
69
-
70
-
71
-
72
-
73
-
74
-
75
-
76
-
77
-
78
-
79
-
80
-
81
-
82
-
83
-
84
-
85
-
86
-
87
-
88
-
89
-
90
-
91
-
92
-
93
-
94
-
95
-
96
-
97
-
98
-
99
-
100
-
101
-
102
-
103
-
104
-
105
-
106
-
107
-
108
-
109
-
110
-
111
-
112
-
113
-
114
-
115
-
116
-
117
-
118
-
119
-
120
-
121
-
122
-
123
-
124
-
125
-
126
-
127
-
128
-
129
-
130
-
131
-
132
-
133
-
134
-
135
-
136
-
137
-
138
-
139
-
140
-
141
-
142
-
143
-
144
-
145
-
146
-
147
-
148
-
149
-
 150
150 -
 151
151 -
 152
152 -
 153
153 -
 154
154 -
 155
155 -
 156
156 -
 157
157 -
 158
158 -
 159
159 -
 160
160 -
 161
161 -
 162
162 -
 163
163 -
 164
164 -
 165
165 -
 166
166 -
 167
167 -
 168
168 -
 169
169 -
 170
170 -
171
-
172
-
173
-
174
-
175
-
176
-
177
-
178
-
179
-
180
-
181
-
182
-
183
-
184
-
185
-
186
-
187
-
188
-
189
-
190
-
191
-
192
-
193
-
194
-
195
-
196
-
197
-
198
-
199
-
200
-
201
-
202
-
203
-
204
-
205
-
206
-
207
-
208
-
209
-
210
-
211
-
212
-
213
-
214
-
215
-
216
-
217
-
218
-
219
-
220
-
221
-
222
-
223
-
224
-
225
-
226
-
227
-
228
-
229
-
230
-
231
-
232
-
233
-
234
-
235
-
236
-
237
-
238
-
239
-
240
-
241
-
242
-
243
-
244
-
245
-
246
-
247
-
248
-
249
-
250
-
251
-
252
-
253
-
254
-
255
-
256
-
257
-
258
-
259
-
260
-
261
-
262
-
263
-
264
-
265
-
266
-
267
-
268
-
269
-
270
-
271
-
272
-
273
-
274
-
275
-
276
-
277
-
278
-
279
-
280
-
281
-
282
 |
 |
adidas Group
/
2012 Annual Report
Group Management Report – Financial Review
138
2012
/
03.2
/
Group Business Performance
/
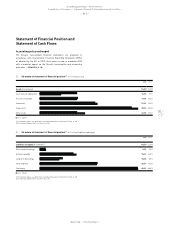
Statement of Financial Position and Statement of Cash Flows
35
/
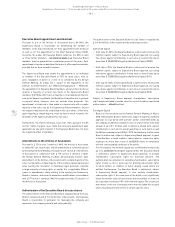
Total assets 1) (€ in millions)
2012 11,651
2011 11,237
2010 10,618
2009 8,875
2008 9,533
1) 2011 restated according to IAS 8, see Note 03, p. 203. Prior years are not restated, see p. 131.
36
/
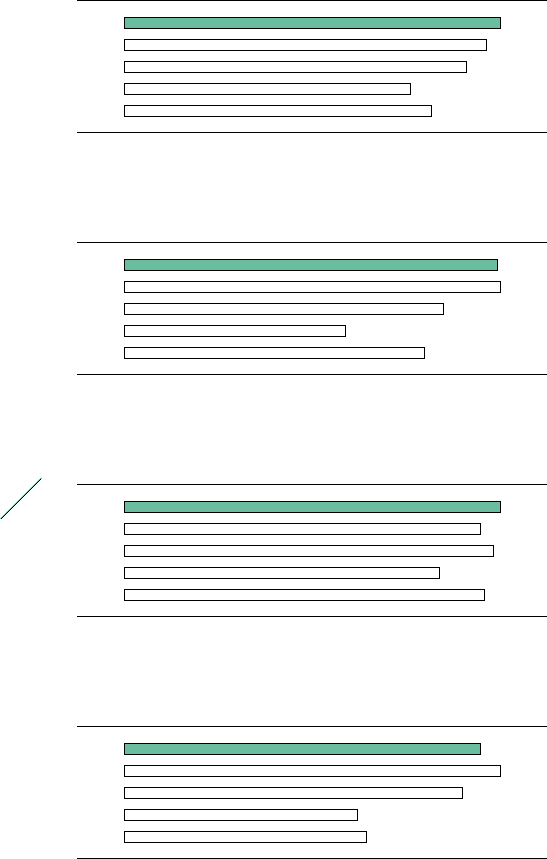
Inventories 1) (€ in millions)
2012 2,486
2011 2,502
2010 2,119
2009 1,471
2008 1,995
1) 2011 restated according to IAS 8, see Note 03, p. 203. Prior years are not restated, see p. 131.
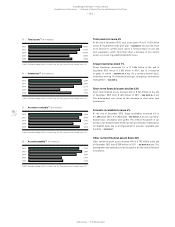
37
/
Accounts receivable 1) (€ in millions)
2012 1,688
2011 1,595
2010 1,667
2009 1,429
2008 1,624
1) 2011 restated according to IAS 8, see Note 03, p. 203. Prior years are not restated, see p. 131.
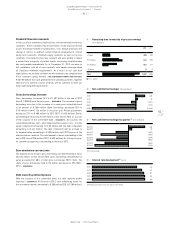
38
/
Accounts payable 1) (€ in millions)
2012 1,790
2011 1,887
2010 1,694
2009 1,166
2008 1,218
1) 2011 restated according to IAS 8, see Note 03, p. 203. Prior years are not restated, see p. 131.
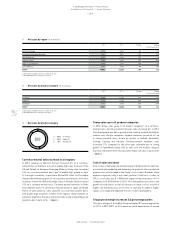
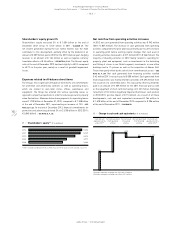
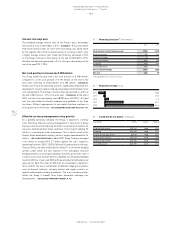
Total assets increase 4%
At the end of December 2012, total assets grew 4% to € 11.651 billion
versus € 11.237 billion in the prior year
/
DIAGRAM 35. This was the result
of an increase in current assets due to a strong increase in cash and
cash equivalents, which more than offset a decrease in non-current
assets as a result of goodwill impairment losses.
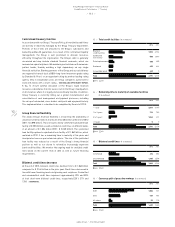
Group inventories down 1%
Group inventories decreased 1% to € 2.486 billion at the end of
December 2012 versus € 2.502 billion in 2011, due to a reduction
in goods in transit
/
SEE NOTE 09, P. 212. On a currency-neutral basis,
inventories were up 1%, reflecting the Group’s strong focus on inventory
management
/
DIAGRAM 36.
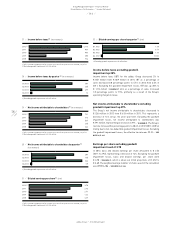
Short-term financial assets decline 43%
Short-term financial assets declined 43% to € 265 million at the end
of December 2012 from € 465 million in 2011
/
SEE NOTE 06, P. 211.
This development was driven by the decrease in short-term cash
investments.
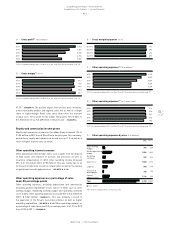
Accounts receivable increase 6%
At the end of December 2012, Group receivables increased 6% to
€ 1.688 billion (2011: € 1.595 billion)
/
SEE NOTE 07, P. 211. On a currency-
neutral basis, receivables were up 8%. This reflects the growth of our
business over the past twelve months as well as a reduction in allowances
for doubtful debts due to an improvement in accounts receivable past
due date
/
DIAGRAM 37.
Other current financial assets down 34%
Other current financial assets declined 34% to € 192 million at the end
of December 2012 from € 289 million in 2011
/
SEE NOTE 08, P. 212. This
development was mainly due to the decrease in the fair value of financial
instruments.