Reebok 2012 Annual Report Download - page 174
Download and view the complete annual report
Please find page 174 of the 2012 Reebok annual report below. You can navigate through the pages in the report by either clicking on the pages listed below, or by using the keyword search tool below to find specific information within the annual report.-
 1
1 -
2
-
3
-
4
-
5
-
6
-
7
-
8
-
9
-
10
-
11
-
12
-
13
-
14
-
15
-
16
-
17
-
18
-
19
-
20
-
21
-
22
-
23
-
24
-
25
-
26
-
27
-
28
-
29
-
30
-
31
-
32
-
33
-
34
-
35
-
36
-
37
-
38
-
39
-
40
-
41
-
42
-
43
-
44
-
45
-
46
-
47
-
48
-
49
-
50
-
51
-
52
-
53
-
54
-
55
-
56
-
57
-
58
-
59
-
60
-
61
-
62
-
63
-
64
-
65
-
66
-
67
-
68
-
69
-
70
-
71
-
72
-
73
-
74
-
75
-
76
-
77
-
78
-
79
-
80
-
81
-
82
-
83
-
84
-
85
-
86
-
87
-
88
-
89
-
90
-
91
-
92
-
93
-
94
-
95
-
96
-
97
-
98
-
99
-
100
-
101
-
102
-
103
-
104
-
105
-
106
-
107
-
108
-
109
-
110
-
111
-
112
-
113
-
114
-
115
-
116
-
117
-
118
-
119
-
120
-
121
-
122
-
123
-
124
-
125
-
126
-
127
-
128
-
129
-
130
-
131
-
132
-
133
-
134
-
135
-
136
-
137
-
138
-
139
-
140
-
141
-
142
-
143
-
144
-
145
-
146
-
147
-
148
-
149
-
150
-
151
-
152
-
153
-
154
-
155
-
156
-
157
-
158
-
159
-
160
-
161
-
162
-
163
-
 164
164 -
 165
165 -
 166
166 -
 167
167 -
 168
168 -
 169
169 -
 170
170 -
 171
171 -
 172
172 -
 173
173 -
 174
174 -
 175
175 -
 176
176 -
 177
177 -
 178
178 -
 179
179 -
 180
180 -
 181
181 -
 182
182 -
 183
183 -
 184
184 -
185
-
186
-
187
-
188
-
189
-
190
-
191
-
192
-
193
-
194
-
195
-
196
-
197
-
198
-
199
-
200
-
201
-
202
-
203
-
204
-
205
-
206
-
207
-
208
-
209
-
210
-
211
-
212
-
213
-
214
-
215
-
216
-
217
-
218
-
219
-
220
-
221
-
222
-
223
-
224
-
225
-
226
-
227
-
228
-
229
-
230
-
231
-
232
-
233
-
234
-
235
-
236
-
237
-
238
-
239
-
240
-
241
-
242
-
243
-
244
-
245
-
246
-
247
-
248
-
249
-
250
-
251
-
252
-
253
-
254
-
255
-
256
-
257
-
258
-
259
-
260
-
261
-
262
-
263
-
264
-
265
-
266
-
267
-
268
-
269
-
270
-
271
-
272
-
273
-
274
-
275
-
276
-
277
-
278
-
279
-
280
-
281
-
282
 |
 |
adidas Group
/
2012 Annual Report
Group Management Report – Financial Review
152
2012
/
03.3
/
Business Performance by Segment
/
Retail Business Performance
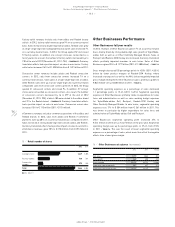
Retail Business Performance
Retail full year results
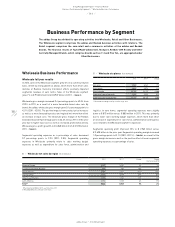
In 2012, Retail revenues increased 14% on a currency-neutral basis
as a result of double-digit growth rates at both adidas and Reebok.
Concept stores, factory outlets and concession corners were all up
versus the prior year. eCommerce grew at a strong double-digit rate.
Currency translation effects positively impacted segmental revenues in
euro terms. Sales grew 21% to € 3.373 billion from € 2.793 billion in the
prior year
/
TABLE 08. Currency-neutral comparable store sales rose 7%
versus the prior year, with increases in all store formats.
Gross margin in the Retail segment decreased 1.7 percentage points to
60.9% from 62.6% in 2011. Increased promotional activities, the rise in
input costs as well as the devaluation of the Russian rouble versus the
US dollar significantly contributed to the margin decline. This more than
offset the positive impact from product price increases. By brand, the
adidas gross margin was down 1.5 percentage points to 62.1% (2011:
63.6%) and Reebok’s gross margin decreased 2.7 percentage points to
55.1% (2011: 57.8%). Retail gross profit increased 18% to € 2.055 billion
from € 1.749 billion in 2011
/
TABLE 08.
Segmental operating expenses as a percentage of sales declined
1.9 percentage points to 39.5% (2011: 41.4%), as a result of operating
leverage in the segment. Segmental operating expenses in Retail
primarily relate to personnel and rent expenses as well as the sales
working budget. Segmental operating expenses increased 15% to
€ 1.331 billion from € 1.156 billion in 2011. This was a result of higher
expenditure for sales force and administration related to the expansion
of the Group’s store base, particularly in emerging markets. In addition,
higher expenses for warehousing and distribution costs also contributed
to the increase.
Segmental operating profit increased 22% to € 724 million versus
€ 593 million in the prior year. Segmental operating margin improved
0.2 percentage points to 21.5% (2011: 21.2%)
/
TABLE 08. This was a
result of lower segmental operating expenses as a percentage of sales,
which more than offset the decline in gross margin.
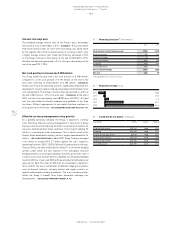
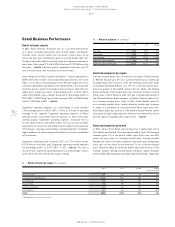
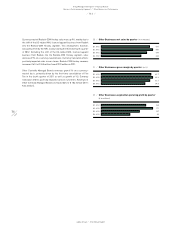
Retail development by region
Currency-neutral Retail sales increased in all regions. Retail revenues
in Western Europe grew 6% on a currency-neutral basis, mainly due
to double-digit sales increases in the UK, Germany and France. Sales
in European Emerging Markets rose 19% on a currency-neutral basis,
driven by growth in Russia/CIS, where both the adidas and Reebok
brands achieved strong double-digit sales increases. Currency-neutral
Retail sales in North America grew 10% due to double-digit growth in
the USA and Canada. Retail revenues in Greater China increased 14%
on a currency-neutral basis. Sales in Other Asian Markets grew 9%
on a currency-neutral basis, mainly driven by double-digit increases
in Japan. In Latin America, currency-neutral Retail sales grew 23%,
with double-digit sales increases in all markets except Panama, where
sales grew at a high-single-digit rate. Currency translation effects had a
positive impact on regional sales in euro terms
/
TABLE 09.
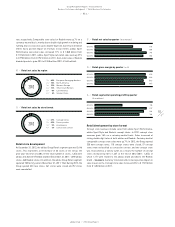
Retail development by brand
In 2012, adidas Group Retail sales increased at a double-digit rate at
both adidas and Reebok. Currency-neutral adidas Sport Performance
revenues grew 11% in the period. adidas Sport Style sales rose 20%
versus the prior year on a currency-neutral basis. Currency-neutral
Reebok sales were 12% higher compared to the prior year. Comparable
store sales for the adidas brand increased 7% on a currency-neutral
basis. Growth at adidas was driven by double-digit sales increases in the
training, football, running and basketball categories. adidas Originals
and the adidas NEO label grew at a double-digit rate and high-single-digit
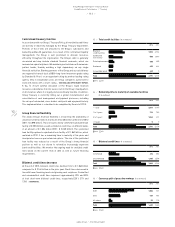
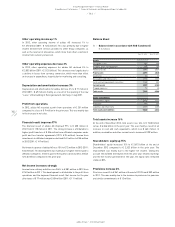
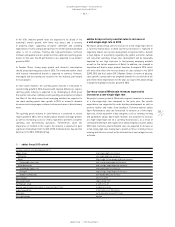
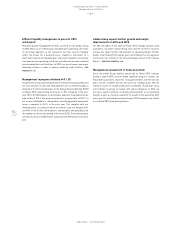
08
/
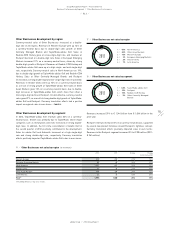
Retail at a glance (€ in millions)
2012 2011 Change
Net sales 3,373 2,793 21%
Gross profit 2,055 1,749 18%
Gross margin 60.9% 62.6% (1.7pp)
Segmental operating profit 724 593 22%
Segmental operating margin 21.5% 21.2% 0.2pp
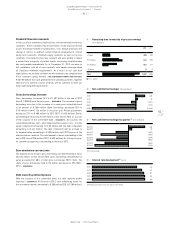
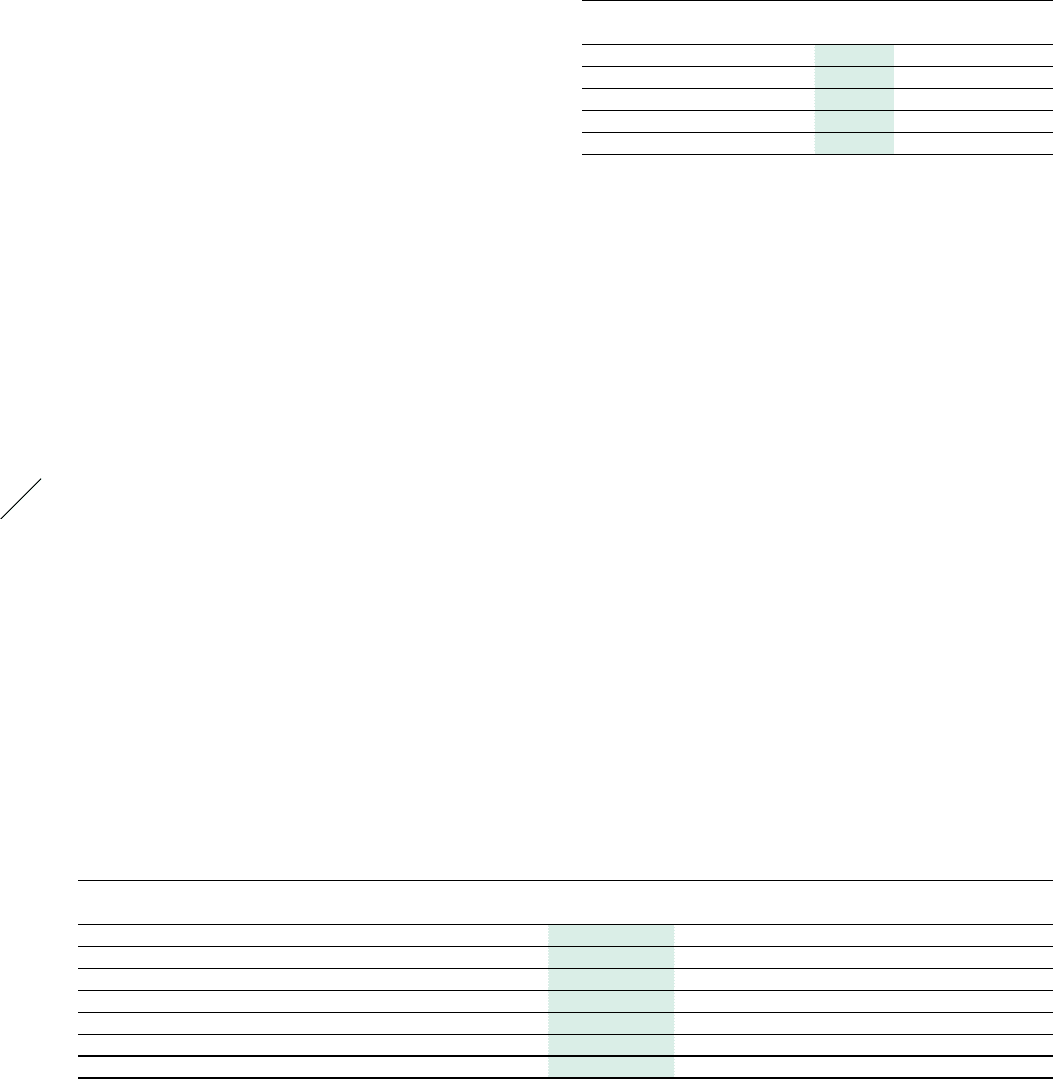
09
/
Retail net sales by region (€ in millions)
2012 2011 Change Change
(currency-neutral)
Western Europe 507 476 7% 6%
European Emerging Markets 1,346 1,055 28% 19%
North America 599 504 19% 10%
Greater China 198 157 26% 14%
Other Asian Markets 436 373 17% 9%
Latin America 287 228 26% 23%
Total 1) 3,373 2,793 21% 14%
1) Rounding differences may arise in totals.