Reebok 2012 Annual Report Download - page 150
Download and view the complete annual report
Please find page 150 of the 2012 Reebok annual report below. You can navigate through the pages in the report by either clicking on the pages listed below, or by using the keyword search tool below to find specific information within the annual report.-
 1
1 -
2
-
3
-
4
-
5
-
6
-
7
-
8
-
9
-
10
-
11
-
12
-
13
-
14
-
15
-
16
-
17
-
18
-
19
-
20
-
21
-
22
-
23
-
24
-
25
-
26
-
27
-
28
-
29
-
30
-
31
-
32
-
33
-
34
-
35
-
36
-
37
-
38
-
39
-
40
-
41
-
42
-
43
-
44
-
45
-
46
-
47
-
48
-
49
-
50
-
51
-
52
-
53
-
54
-
55
-
56
-
57
-
58
-
59
-
60
-
61
-
62
-
63
-
64
-
65
-
66
-
67
-
68
-
69
-
70
-
71
-
72
-
73
-
74
-
75
-
76
-
77
-
78
-
79
-
80
-
81
-
82
-
83
-
84
-
85
-
86
-
87
-
88
-
89
-
90
-
91
-
92
-
93
-
94
-
95
-
96
-
97
-
98
-
99
-
100
-
101
-
102
-
103
-
104
-
105
-
106
-
107
-
108
-
109
-
110
-
111
-
112
-
113
-
114
-
115
-
116
-
117
-
118
-
119
-
120
-
121
-
122
-
123
-
124
-
125
-
126
-
127
-
128
-
129
-
130
-
131
-
132
-
133
-
134
-
135
-
136
-
137
-
138
-
139
-
 140
140 -
 141
141 -
 142
142 -
 143
143 -
 144
144 -
 145
145 -
 146
146 -
 147
147 -
 148
148 -
 149
149 -
 150
150 -
 151
151 -
 152
152 -
 153
153 -
 154
154 -
 155
155 -
 156
156 -
 157
157 -
 158
158 -
 159
159 -
 160
160 -
161
-
162
-
163
-
164
-
165
-
166
-
167
-
168
-
169
-
170
-
171
-
172
-
173
-
174
-
175
-
176
-
177
-
178
-
179
-
180
-
181
-
182
-
183
-
184
-
185
-
186
-
187
-
188
-
189
-
190
-
191
-
192
-
193
-
194
-
195
-
196
-
197
-
198
-
199
-
200
-
201
-
202
-
203
-
204
-
205
-
206
-
207
-
208
-
209
-
210
-
211
-
212
-
213
-
214
-
215
-
216
-
217
-
218
-
219
-
220
-
221
-
222
-
223
-
224
-
225
-
226
-
227
-
228
-
229
-
230
-
231
-
232
-
233
-
234
-
235
-
236
-
237
-
238
-
239
-
240
-
241
-
242
-
243
-
244
-
245
-
246
-
247
-
248
-
249
-
250
-
251
-
252
-
253
-
254
-
255
-
256
-
257
-
258
-
259
-
260
-
261
-
262
-
263
-
264
-
265
-
266
-
267
-
268
-
269
-
270
-
271
-
272
-
273
-
274
-
275
-
276
-
277
-
278
-
279
-
280
-
281
-
282
 |
 |
2
adidas Group
/
2012 Annual Report
Group Management Report – Financial Review
128
2012
/
03.2
/
Group Business Performance
/
Economic and Sector Development
Group Business Performance
In 2012, the adidas Group delivered a strong financial performance despite macroeconomic challenges
in many regions, especially Western Europe. Currency-neutral Group sales increased 6% as a result
of double-digit growth in Retail as well as in Other Businesses. In euro terms, adidas Group revenues
grew 12% to € 14.883 billion from € 13.322 billion in 2011. The Group’s gross margin increased
0.2 percentage points to 47.7% (2011: 47.5%), as the positive impact from product price increases, a
more favourable product and regional sales mix as well as a larger share of higher-margin Retail sales
more than offset the increase in input costs. The Group’s gross profit rose 12% to € 7.103 billion in
2012 versus € 6.329 billion in 2011. In 2012, the adidas Group incurred one-off expenses in an amount
of € 265 million, which are related to the goodwill impairment for several cash-generating units of
the Group. These one-off expenses were non-cash in nature and did not affect the adidas Group’s
liquidity. Excluding these one-off expenses, the Group’s operating profit grew 24% to € 1.185 billion,
representing an operating margin of 8.0%, up 0.8 percentage points compared to the prior year. Net
income attributable to shareholders excluding goodwill impairment losses was up 29% to € 791 million.
Basic and diluted earnings per share excluding one-off expenses amounted to € 3.78 in 2012
(2011: € 2.93), which is above our initial guidance of € 3.52 to € 3.68.
Economic and Sector Development
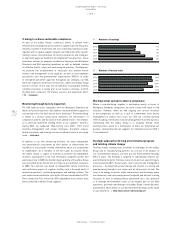
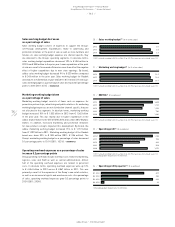
Global economy expands 2.3% in 2012
In 2012, according to the World Bank, global GDP growth moderated
to 2.3%, compared to 2.7% in the prior year. The emerging markets
outperformed developed economies, growing 5.1% and 1.3%
respectively. Stabilising inflationary pressures and increases in real
disposable incomes supported domestic consumption and economic
activity, particularly in Asia’s emerging markets. Conversely, many
developed markets continued to face considerable economic challenges,
mainly driven by sovereign debt concerns. Despite strengthened policy
actions, that temporarily helped lower the debt crisis impact in most of
these economies, their low growth and the implementation of austerity
measures remained significant negative pressures to global economic
expansion.
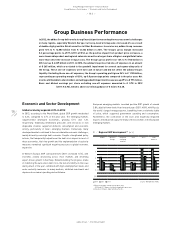
In Western Europe, GDP contracted 0.2% (2011: increased 1.5%), with
economic activity decreasing across most markets and offsetting
export-driven growth in Germany. Notwithstanding the progress made
in stabilising the euro area’s debt crisis, the lack of visibility on the issue
during much of the year, combined with high unemployment levels and
acute austerity measures in many markets, inhibited investment and
depressed consumer spending and confidence.
European emerging markets recorded positive GDP growth of around
2.8%, albeit at lower levels than in recent years (2011: 4.8%), with Russia,
the world’s largest energy exporter, benefiting from a relatively stable
oil price, which supported government spending and consumption.
Nonetheless, the contraction in the euro area negatively impacted
exports and industrial output for many of the economies in the European
emerging markets.
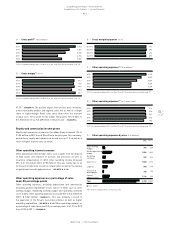
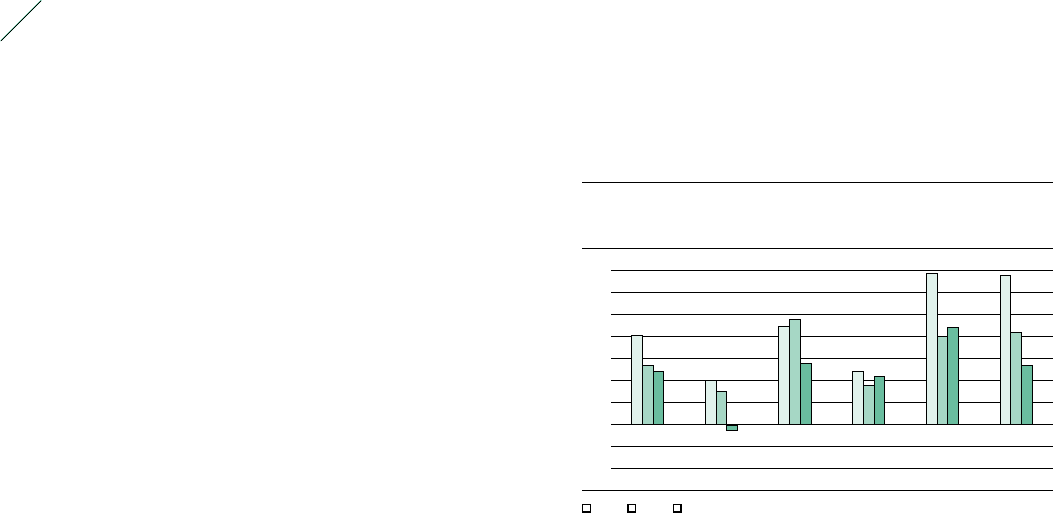
01
/
Regional GDP development 1) (in %)
Global Western
Europe
European
emerging
markets
USA Asia 2) Latin
America
6
4
2
0
(2)
■ 2010 ■ 2011 ■ 2012 Source: World Bank, HSBC.
1) Real, percentage change versus prior year;
2010 and 2011 figures restated compared to prior year.
2) Asia also includes Japan and Area Pacific.