Reebok 2012 Annual Report Download - page 157
Download and view the complete annual report
Please find page 157 of the 2012 Reebok annual report below. You can navigate through the pages in the report by either clicking on the pages listed below, or by using the keyword search tool below to find specific information within the annual report.-
 1
1 -
2
-
3
-
4
-
5
-
6
-
7
-
8
-
9
-
10
-
11
-
12
-
13
-
14
-
15
-
16
-
17
-
18
-
19
-
20
-
21
-
22
-
23
-
24
-
25
-
26
-
27
-
28
-
29
-
30
-
31
-
32
-
33
-
34
-
35
-
36
-
37
-
38
-
39
-
40
-
41
-
42
-
43
-
44
-
45
-
46
-
47
-
48
-
49
-
50
-
51
-
52
-
53
-
54
-
55
-
56
-
57
-
58
-
59
-
60
-
61
-
62
-
63
-
64
-
65
-
66
-
67
-
68
-
69
-
70
-
71
-
72
-
73
-
74
-
75
-
76
-
77
-
78
-
79
-
80
-
81
-
82
-
83
-
84
-
85
-
86
-
87
-
88
-
89
-
90
-
91
-
92
-
93
-
94
-
95
-
96
-
97
-
98
-
99
-
100
-
101
-
102
-
103
-
104
-
105
-
106
-
107
-
108
-
109
-
110
-
111
-
112
-
113
-
114
-
115
-
116
-
117
-
118
-
119
-
120
-
121
-
122
-
123
-
124
-
125
-
126
-
127
-
128
-
129
-
130
-
131
-
132
-
133
-
134
-
135
-
136
-
137
-
138
-
139
-
140
-
141
-
142
-
143
-
144
-
145
-
146
-
 147
147 -
 148
148 -
 149
149 -
 150
150 -
 151
151 -
 152
152 -
 153
153 -
 154
154 -
 155
155 -
 156
156 -
 157
157 -
 158
158 -
 159
159 -
 160
160 -
 161
161 -
 162
162 -
 163
163 -
 164
164 -
 165
165 -
 166
166 -
 167
167 -
168
-
169
-
170
-
171
-
172
-
173
-
174
-
175
-
176
-
177
-
178
-
179
-
180
-
181
-
182
-
183
-
184
-
185
-
186
-
187
-
188
-
189
-
190
-
191
-
192
-
193
-
194
-
195
-
196
-
197
-
198
-
199
-
200
-
201
-
202
-
203
-
204
-
205
-
206
-
207
-
208
-
209
-
210
-
211
-
212
-
213
-
214
-
215
-
216
-
217
-
218
-
219
-
220
-
221
-
222
-
223
-
224
-
225
-
226
-
227
-
228
-
229
-
230
-
231
-
232
-
233
-
234
-
235
-
236
-
237
-
238
-
239
-
240
-
241
-
242
-
243
-
244
-
245
-
246
-
247
-
248
-
249
-
250
-
251
-
252
-
253
-
254
-
255
-
256
-
257
-
258
-
259
-
260
-
261
-
262
-
263
-
264
-
265
-
266
-
267
-
268
-
269
-
270
-
271
-
272
-
273
-
274
-
275
-
276
-
277
-
278
-
279
-
280
-
281
-
282
 |
 |
adidas Group
/
2012 Annual Report
Group Management Report – Financial Review
135
2012
/
03.2
/
Group Business Performance
/
Income Statement
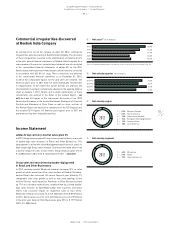
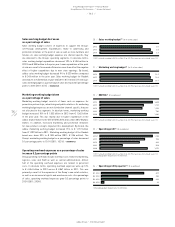
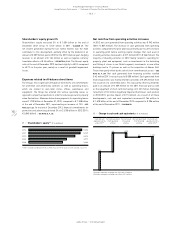
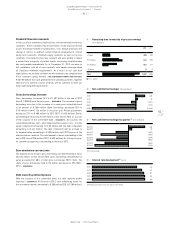
Operating margin excluding goodwill impairment
improves to 8.0%
Group operating profit decreased 3% to € 920 million in 2012 versus
€ 953 million in 2011. The operating margin of the adidas Group
declined 1.0 percentage points to 6.2% (2011: 7.2%). Excluding
the goodwill impairment losses, the operating profit grew 24% to
€ 1.185 billion
/
DIAGRAM 23, representing an operating margin of
8.0%
/
DIAGRAM 25, which is in line with our initial expectations of
approaching 8.0%. This development resulted from the increase in gross
margin and the lower other operating expenses as a percentage of
sales.
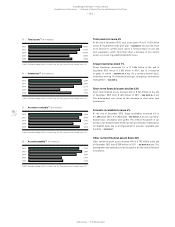
Financial income up 17%
Financial income increased 17% to € 36 million in 2012 from € 31 million
in the prior year, mainly due to an increase in interest income as a result
of higher average cash and cash equivalents during the year
/
SEE NOTE
33, P. 230.
Financial expenses decrease 8%
Financial expenses decreased 8% to € 105 million in 2012 (2011:
€ 115 million)
/
DIAGRAM 26. A decrease in interest expenses of 9% was
the main contributor to the decline. Negative exchange rate effects were
similar to the prior year
/
SEE NOTE 33, P. 230.
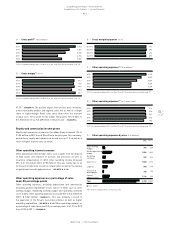
Number of Group employees down 1%
At the end of December 2012, the Group employed 46,306 people.
This represents a decline of 1% versus the prior year level of 46,824.
Increased efficiencies in the Group’s own-retail store operations as
well as reorganisation initiatives at Reebok were the main drivers
of this development. On a full-time equivalent basis, the number of
employees also decreased 1% to 40,168 at the end of 2012 (2011: 40,637)
/
SEE EMPLOYEES, P. 111.
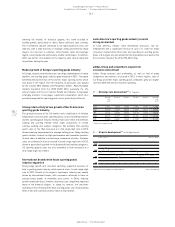
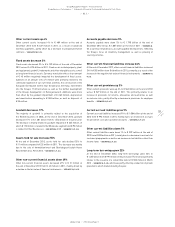
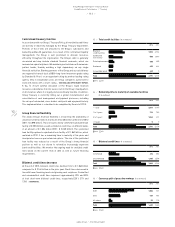
EBITDA grows 21%
The Group’s earnings before interest, taxes, depreciation and
amortisation as well as impairment losses/reversal of impairment
losses on property, plant and equipment and intangible assets
(EBITDA) increased 21% to € 1.445 billion in 2012 (2011:
€ 1.199 billion)
/
DIAGRAM 22. Depreciation and amortisation expense for
tangible and intangible assets as well as impairment losses more than
doubled to € 532 million in 2012 (2011: € 252 million). This development
was mainly due to one-off expenses of € 265 million resulting from
goodwill impairment in 2012. In accordance with IFRS, intangible
assets with indefinite useful lives (goodwill and trademarks) are
tested annually and additionally when there are indications of potential
impairment. In this connection, impairment of intangible assets with
unlimited useful lives was incurred in 2012.
Goodwill impairment in an amount of € 265 million
As a result of the re-evaluation of medium-term growth prospects
of several geographic regions and segments, the adidas Group has
impaired goodwill and recorded a € 265 million pre-tax charge as at
December 31, 2012. The wholesale cash-generating unit North America
was impaired by € 106 million, Latin America by € 41 million, Brazil
by € 15 million and Iberia by € 11 million. The impairment loss was
mainly the result of adjusted growth assumptions for the Reebok brand,
especially in North America, Latin America and Brazil, and an increase
in the country-specific discount rates as a result of the euro crisis. In
addition, goodwill of € 68 million allocated to Reebok-CCM Hockey was
completely impaired and € 24 million allocated to Rockport was partially
impaired. These impairment losses are primarily the result of the
re-evaluation of future growth prospects and, with regard to Rockport,
also due to an increase in the discount rate. The impairment loss of
€ 265 million was non-cash in nature and does not affect the adidas
Group’s liquidity
/
SEE NOTE 02, P. 197.
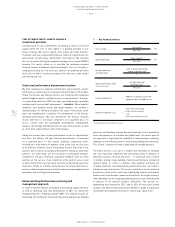
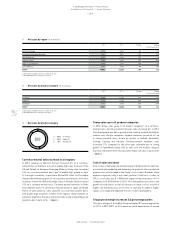
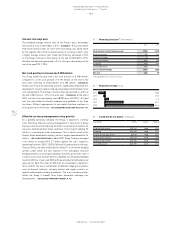
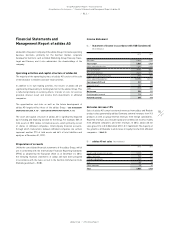
25
/
Operating margin 1) (in %)
2012 2) 8.0
2011 7.2
2010 7.5
2009 4.9
2008 9.9
1) 2011 restated according to IAS 8, see Note 03, p. 203. Prior years are not restated, see p. 131.
2) Excluding goodwill impairment of € 265 million.
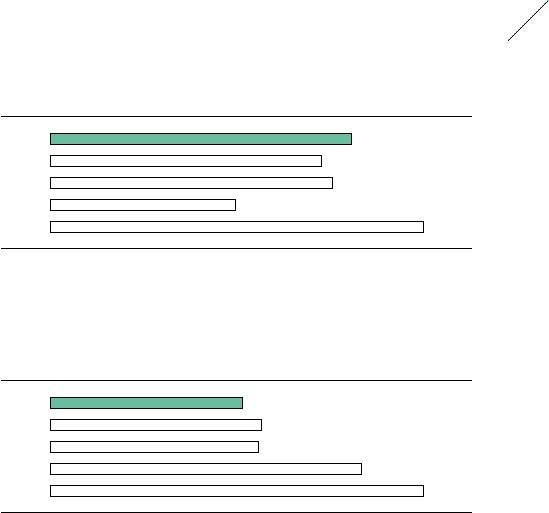
26
/
Financial expenses 1) (€ in millions)
2012 105
2011 115
2010 113
2009 169
2008 203
1) 2011 restated according to IAS 8, see Note 03, p. 203. Prior years are not restated, see p. 131.