Reebok 2012 Annual Report Download - page 254
Download and view the complete annual report
Please find page 254 of the 2012 Reebok annual report below. You can navigate through the pages in the report by either clicking on the pages listed below, or by using the keyword search tool below to find specific information within the annual report.-
 1
1 -
2
-
3
-
4
-
5
-
6
-
7
-
8
-
9
-
10
-
11
-
12
-
13
-
14
-
15
-
16
-
17
-
18
-
19
-
20
-
21
-
22
-
23
-
24
-
25
-
26
-
27
-
28
-
29
-
30
-
31
-
32
-
33
-
34
-
35
-
36
-
37
-
38
-
39
-
40
-
41
-
42
-
43
-
44
-
45
-
46
-
47
-
48
-
49
-
50
-
51
-
52
-
53
-
54
-
55
-
56
-
57
-
58
-
59
-
60
-
61
-
62
-
63
-
64
-
65
-
66
-
67
-
68
-
69
-
70
-
71
-
72
-
73
-
74
-
75
-
76
-
77
-
78
-
79
-
80
-
81
-
82
-
83
-
84
-
85
-
86
-
87
-
88
-
89
-
90
-
91
-
92
-
93
-
94
-
95
-
96
-
97
-
98
-
99
-
100
-
101
-
102
-
103
-
104
-
105
-
106
-
107
-
108
-
109
-
110
-
111
-
112
-
113
-
114
-
115
-
116
-
117
-
118
-
119
-
120
-
121
-
122
-
123
-
124
-
125
-
126
-
127
-
128
-
129
-
130
-
131
-
132
-
133
-
134
-
135
-
136
-
137
-
138
-
139
-
140
-
141
-
142
-
143
-
144
-
145
-
146
-
147
-
148
-
149
-
150
-
151
-
152
-
153
-
154
-
155
-
156
-
157
-
158
-
159
-
160
-
161
-
162
-
163
-
164
-
165
-
166
-
167
-
168
-
169
-
170
-
171
-
172
-
173
-
174
-
175
-
176
-
177
-
178
-
179
-
180
-
181
-
182
-
183
-
184
-
185
-
186
-
187
-
188
-
189
-
190
-
191
-
192
-
193
-
194
-
195
-
196
-
197
-
198
-
199
-
200
-
201
-
202
-
203
-
204
-
205
-
206
-
207
-
208
-
209
-
210
-
211
-
212
-
213
-
214
-
215
-
216
-
217
-
218
-
219
-
220
-
221
-
222
-
223
-
224
-
225
-
226
-
227
-
228
-
229
-
230
-
231
-
232
-
233
-
234
-
235
-
236
-
237
-
238
-
239
-
240
-
241
-
242
-
243
-
 244
244 -
 245
245 -
 246
246 -
 247
247 -
 248
248 -
 249
249 -
 250
250 -
 251
251 -
 252
252 -
 253
253 -
 254
254 -
 255
255 -
 256
256 -
 257
257 -
 258
258 -
 259
259 -
 260
260 -
 261
261 -
 262
262 -
 263
263 -
 264
264 -
265
-
266
-
267
-
268
-
269
-
270
-
271
-
272
-
273
-
274
-
275
-
276
-
277
-
278
-
279
-
280
-
281
-
282
 |
 |

adidas Group
/
2012 Annual Report
Consolidated Financial Statements
232
2012
/
04.8
/
Notes
/
Notes to the Consolidated Income Statement
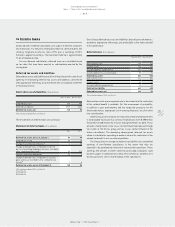
Tax expenses
Tax expenses are split as follows:
Income tax expenses (€ in millions)
Year ending
Dec. 31, 2012
Year ending
Dec. 31, 2011 1)
Current tax expenses 407 289
Deferred tax income (80) (28)
Income tax expenses 327 261
1) Restated according to IAS 8, see Note 03.
The deferred tax income includes tax income of € 60 million in total
(2011: € 44 million) related to the origination and reversal of temporary
differences.
The effective tax rate of the Group differs from an assumed tax rate
of 30% for the year ending December 31, 2012 as follows:
Tax rate reconciliation
Year ending Dec. 31, 2012 Year ending Dec. 31, 2011 1)
€ in millions in % € in millions in %
Expected income tax
expenses 255 30.0 261 30.0
Tax rate differentials (110) (12.9) (83) (9.5)
Non-deductible expenses 1 0.1 6 0.6
Goodwill impairment
losses 79 9.3 – –
Losses for which benefits
were not recognisable
and changes in valuation
allowances 53 6.2 23 2.7
Changes in tax rates (16) (1.9) (8) (0.9)
Other, net 1 0.1 1 0.1
263 30.9 200 23.0
Withholding tax expenses 64 7.5 61 7.0
Income tax expenses 327 38.4 261 30.0
1) Restated according to IAS 8, see Note 03.
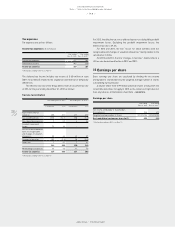
For 2012, the effective tax rate is affected by non-tax-deductible goodwill
impairment losses. Excluding the goodwill impairment losses, the
effective tax rate is 29.3%.
For 2012 and 2011, the line “losses for which benefits were not
recognisable and changes in valuation allowances” mainly relates to the
subsidiaries in India.
For 2012 and 2011, the line “changes in tax rates” mainly reflects a
UK tax rate deduction effective in 2012 and 2011.
35 Earnings per share
Basic earnings per share are calculated by dividing the net income
attributable to shareholders by the weighted average number of shares
outstanding during the year.
A dilutive effect from 5.99 million potential shares arising from the
convertible bond does not apply in 2012 as the conversion right does not
have any value as at the balance sheet date
/
SEE NOTE 18.
Earnings per share
Year ending
Dec. 31, 2012
Year ending
Dec. 31, 2011 1)
Net income attributable to shareholders
(€ in millions) 526 613
Weighted average number of shares 209,216,186 209,216,186
Basic and diluted earnings per share (in €) 2.52 2.93
1) Restated according to IAS 8, see Note 03.