Reebok 2012 Annual Report Download - page 147
Download and view the complete annual report
Please find page 147 of the 2012 Reebok annual report below. You can navigate through the pages in the report by either clicking on the pages listed below, or by using the keyword search tool below to find specific information within the annual report.-
 1
1 -
2
-
3
-
4
-
5
-
6
-
7
-
8
-
9
-
10
-
11
-
12
-
13
-
14
-
15
-
16
-
17
-
18
-
19
-
20
-
21
-
22
-
23
-
24
-
25
-
26
-
27
-
28
-
29
-
30
-
31
-
32
-
33
-
34
-
35
-
36
-
37
-
38
-
39
-
40
-
41
-
42
-
43
-
44
-
45
-
46
-
47
-
48
-
49
-
50
-
51
-
52
-
53
-
54
-
55
-
56
-
57
-
58
-
59
-
60
-
61
-
62
-
63
-
64
-
65
-
66
-
67
-
68
-
69
-
70
-
71
-
72
-
73
-
74
-
75
-
76
-
77
-
78
-
79
-
80
-
81
-
82
-
83
-
84
-
85
-
86
-
87
-
88
-
89
-
90
-
91
-
92
-
93
-
94
-
95
-
96
-
97
-
98
-
99
-
100
-
101
-
102
-
103
-
104
-
105
-
106
-
107
-
108
-
109
-
110
-
111
-
112
-
113
-
114
-
115
-
116
-
117
-
118
-
119
-
120
-
121
-
122
-
123
-
124
-
125
-
126
-
127
-
128
-
129
-
130
-
131
-
132
-
133
-
134
-
135
-
136
-
 137
137 -
 138
138 -
 139
139 -
 140
140 -
 141
141 -
 142
142 -
 143
143 -
 144
144 -
 145
145 -
 146
146 -
 147
147 -
 148
148 -
 149
149 -
 150
150 -
 151
151 -
 152
152 -
 153
153 -
 154
154 -
 155
155 -
 156
156 -
 157
157 -
158
-
159
-
160
-
161
-
162
-
163
-
164
-
165
-
166
-
167
-
168
-
169
-
170
-
171
-
172
-
173
-
174
-
175
-
176
-
177
-
178
-
179
-
180
-
181
-
182
-
183
-
184
-
185
-
186
-
187
-
188
-
189
-
190
-
191
-
192
-
193
-
194
-
195
-
196
-
197
-
198
-
199
-
200
-
201
-
202
-
203
-
204
-
205
-
206
-
207
-
208
-
209
-
210
-
211
-
212
-
213
-
214
-
215
-
216
-
217
-
218
-
219
-
220
-
221
-
222
-
223
-
224
-
225
-
226
-
227
-
228
-
229
-
230
-
231
-
232
-
233
-
234
-
235
-
236
-
237
-
238
-
239
-
240
-
241
-
242
-
243
-
244
-
245
-
246
-
247
-
248
-
249
-
250
-
251
-
252
-
253
-
254
-
255
-
256
-
257
-
258
-
259
-
260
-
261
-
262
-
263
-
264
-
265
-
266
-
267
-
268
-
269
-
270
-
271
-
272
-
273
-
274
-
275
-
276
-
277
-
278
-
279
-
280
-
281
-
282
 |
 |

adidas Group
/
2012 Annual Report
Group Management Report – Financial Review
125
2012
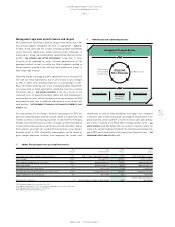
Internal Group Management System
/
03.1
/
We also aim to increase operational efficiency and reduce operating
overhead expenses as a percentage of sales. In this respect, we regularly
review our operational structure – streamlining business processes,
eliminating redundancies and leveraging the scale of our organisation.
These measures may also be supplemented by short-term initiatives
such as temporarily curtailing operational investments, for example
staff hiring.
Furthermore, we carefully analyse the different mix effects which
impact the Group’s profit ratios, as our business performance differs
significantly across geographical markets, business models and
channels. The strategic implications and decisions taken in this respect
are a key element of our strategic planning efforts, ensuring clarity and
focus of the organisation to maximise the Group’s operating margin.
Optimisation of non-operating components
Our Group also puts a high priority on the optimisation of non-operating
components such as financial result and taxes, as these items strongly
impact the Group’s cash outflows and therefore the Group’s free cash
flow. Financial expenses are managed centrally by our Group Treasury
department
/
SEE TREASURY, P. 141. The Group’s current and future tax
expenditure is optimised globally by our Group Taxes department.
Tight operating working capital management
Due to a comparatively low level of fixed assets required in our business,
the efficiency of the Group’s balance sheet depends to a large degree
on our operating working capital management. Our key metric is
operating working capital as a percentage of net sales. Monitoring
the development of this key metric facilitates the measurement of our
progress in improving the efficiency of our business cycle. We have
significantly enhanced operating working capital management over
recent years through improvement of our Group’s inventories, accounts
receivable and accounts payable.
We strive to proactively manage our inventory levels to meet market
demand and ensure fast replenishment. Inventory ageing is controlled
tightly to reduce inventory obsolescence and to optimise clearance
activities. As a result, stock turn development is the key performance
indicator as it measures the number of times average inventory is sold
during a year, highlighting the efficiency of capital locked up in products.
To minimise capital tied up in accounts receivable, we strive to improve
collection efforts in order to reduce the Days of Sales Outstanding (DSO)
and improve the ageing of accounts receivable. Likewise, we strive to
optimise payment terms with our suppliers to best manage our accounts
payable.
Capital expenditure targeted to maximise future returns
Improving the effectiveness of the Group’s capital expenditure is
another lever to maximise our operating cash flow. We control capital
expenditure with a top-down, bottom-up approach. In a first step, Group
management defines focus areas and an overall investment budget
based on investment requests from various functions of the organisation.
Our operating units then align their initiatives within the scope of
assigned priorities and available budget. We evaluate potential return
on planned investments utilising the net present value method. Risk
is accounted for, adding a risk premium to the cost of capital and thus
reducing our estimate of future earnings streams where appropriate.
By means of scenario planning, the sensitivity of investment returns
is tested against changes in initial assumptions. For large investment
projects, timelines and deviations versus budget are monitored on a
monthly basis throughout the course of the project.
The final step of optimising return on investments is our selective
post-mortem reviews, where larger projects in particular are evaluated
and learnings are documented to be available for future strategic or
operational capital expenditure decisions.
M&A activities focus on long-term value
creation potential
We see the vast majority of the Group’s future growth opportunities
coming from our existing portfolio of brands. However, as part of our
commitment to ensuring sustainable profitable development, we
regularly review merger and acquisition (M&A) options that may provide
additional commercial and operational opportunities. Acquisitive growth
focus is primarily related to improving the Group’s positioning within
a certain sports category, strengthening our technology portfolio or
addressing new consumer segments.
The strategies of any potential acquisition candidate must correspond
with the Group’s strategic direction. Maximising return on invested
capital above the cost of capital in the long term is a core consideration in
our decision-making process. Of particular importance is evaluating the
potential impact on our Group’s free cash flow. We assess current and
future projected key financial metrics to evaluate a target’s operating
profit potential. In addition, careful consideration is given to potential
financing needs and their impact on the Group’s financial leverage.