Reebok 2012 Annual Report Download - page 249
Download and view the complete annual report
Please find page 249 of the 2012 Reebok annual report below. You can navigate through the pages in the report by either clicking on the pages listed below, or by using the keyword search tool below to find specific information within the annual report.-
 1
1 -
2
-
3
-
4
-
5
-
6
-
7
-
8
-
9
-
10
-
11
-
12
-
13
-
14
-
15
-
16
-
17
-
18
-
19
-
20
-
21
-
22
-
23
-
24
-
25
-
26
-
27
-
28
-
29
-
30
-
31
-
32
-
33
-
34
-
35
-
36
-
37
-
38
-
39
-
40
-
41
-
42
-
43
-
44
-
45
-
46
-
47
-
48
-
49
-
50
-
51
-
52
-
53
-
54
-
55
-
56
-
57
-
58
-
59
-
60
-
61
-
62
-
63
-
64
-
65
-
66
-
67
-
68
-
69
-
70
-
71
-
72
-
73
-
74
-
75
-
76
-
77
-
78
-
79
-
80
-
81
-
82
-
83
-
84
-
85
-
86
-
87
-
88
-
89
-
90
-
91
-
92
-
93
-
94
-
95
-
96
-
97
-
98
-
99
-
100
-
101
-
102
-
103
-
104
-
105
-
106
-
107
-
108
-
109
-
110
-
111
-
112
-
113
-
114
-
115
-
116
-
117
-
118
-
119
-
120
-
121
-
122
-
123
-
124
-
125
-
126
-
127
-
128
-
129
-
130
-
131
-
132
-
133
-
134
-
135
-
136
-
137
-
138
-
139
-
140
-
141
-
142
-
143
-
144
-
145
-
146
-
147
-
148
-
149
-
150
-
151
-
152
-
153
-
154
-
155
-
156
-
157
-
158
-
159
-
160
-
161
-
162
-
163
-
164
-
165
-
166
-
167
-
168
-
169
-
170
-
171
-
172
-
173
-
174
-
175
-
176
-
177
-
178
-
179
-
180
-
181
-
182
-
183
-
184
-
185
-
186
-
187
-
188
-
189
-
190
-
191
-
192
-
193
-
194
-
195
-
196
-
197
-
198
-
199
-
200
-
201
-
202
-
203
-
204
-
205
-
206
-
207
-
208
-
209
-
210
-
211
-
212
-
213
-
214
-
215
-
216
-
217
-
218
-
219
-
220
-
221
-
222
-
223
-
224
-
225
-
226
-
227
-
228
-
229
-
230
-
231
-
232
-
233
-
234
-
235
-
236
-
237
-
238
-
 239
239 -
 240
240 -
 241
241 -
 242
242 -
 243
243 -
 244
244 -
 245
245 -
 246
246 -
 247
247 -
 248
248 -
 249
249 -
 250
250 -
 251
251 -
 252
252 -
 253
253 -
 254
254 -
 255
255 -
 256
256 -
 257
257 -
 258
258 -
 259
259 -
260
-
261
-
262
-
263
-
264
-
265
-
266
-
267
-
268
-
269
-
270
-
271
-
272
-
273
-
274
-
275
-
276
-
277
-
278
-
279
-
280
-
281
-
282
 |
 |
adidas Group
/
2012 Annual Report
Consolidated Financial Statements
227
2012
/
04.8
/
Notes
/
Notes to the Consolidated Statement of Financial Position
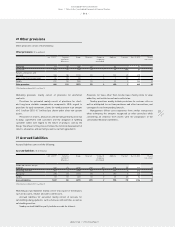
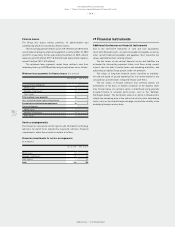
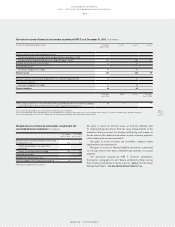
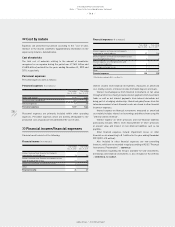
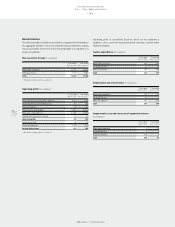
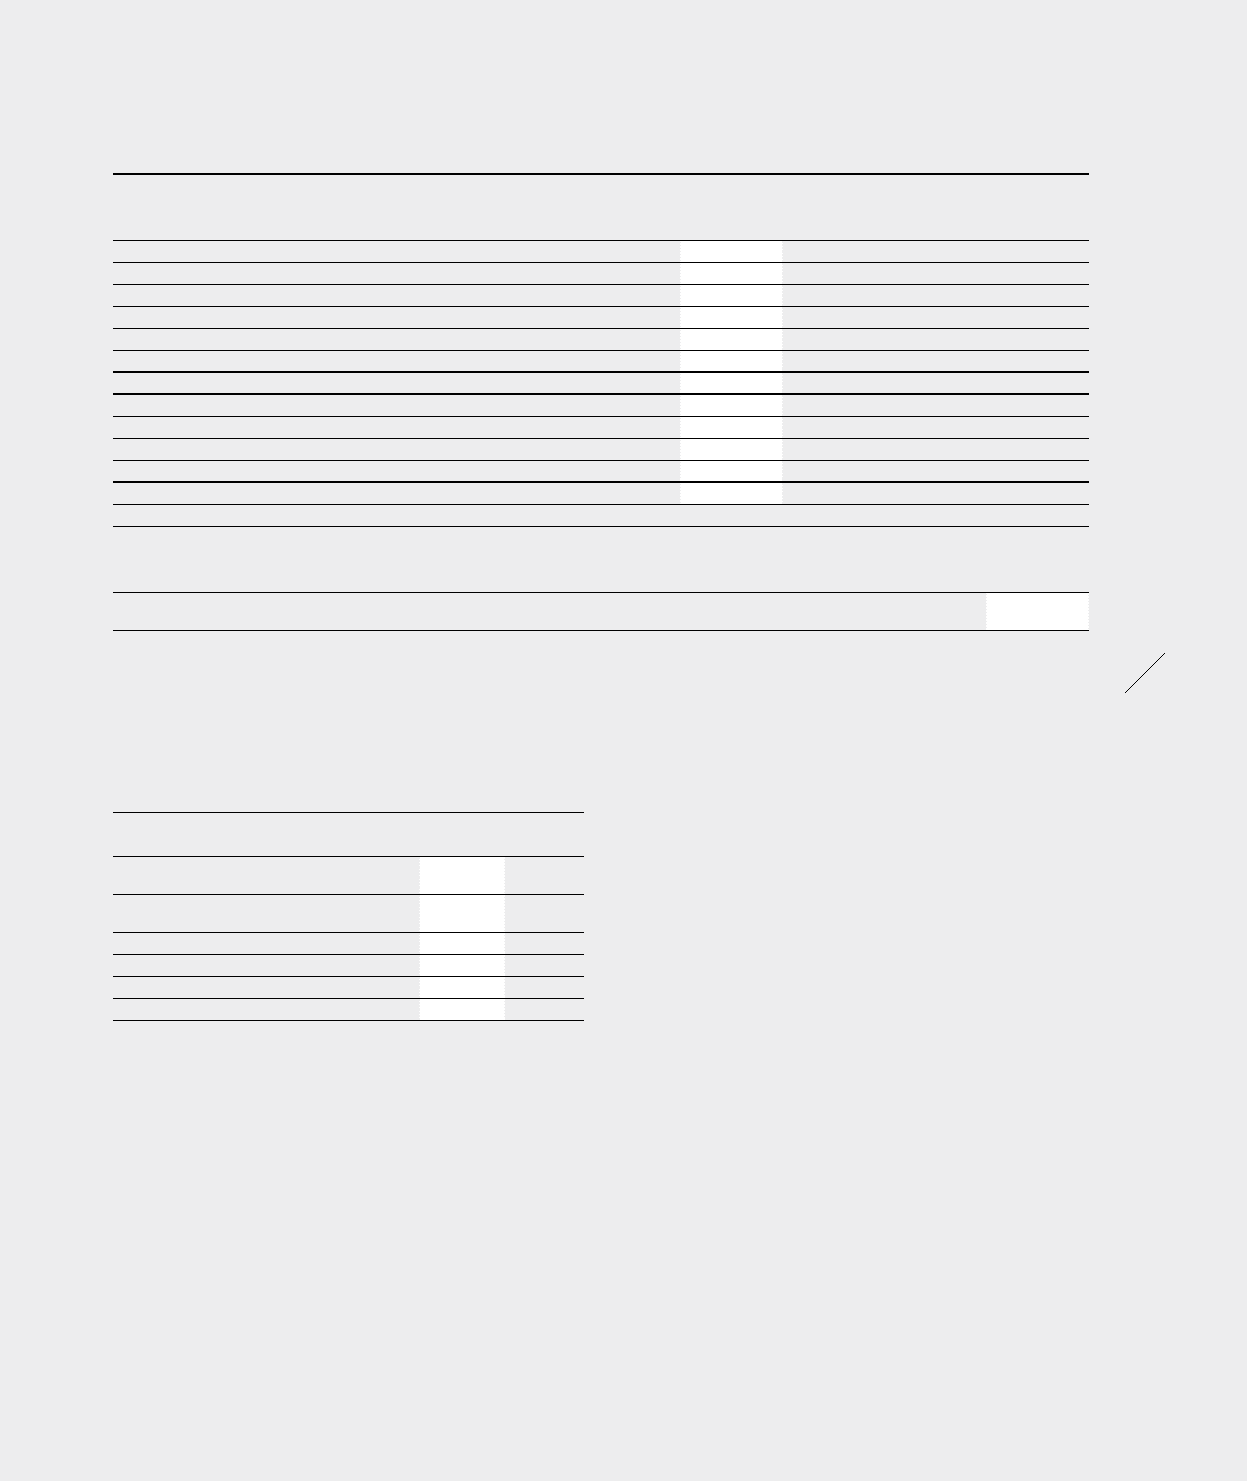
Net gains/losses on financial instruments recognised in the
consolidated income statement (€ in millions)
Year ending
Dec. 31, 2012
Year ending
Dec. 31, 2011 1)
Financial assets or financial liabilities at fair value
through profit or loss (20) (12)
Thereof: designated as such upon initial
recognition – –
Thereof: classified as held for trading (20) (12)
Loans and receivables 1 (43)
Available-for-sale financial assets – –
Financial liabilities measured at amortised cost 14 12
1) Restated according to IAS 8, see Note 03.
Net gains or losses on financial assets or financial liabilities held
for trading include the effects from fair value measurements of the
derivatives that are not part of a hedging relationship, and changes in
the fair value of other financial instruments as well as interest payments
which mainly relate to investment funds.
Net gains or losses on loans and receivables comprise mainly
impairment losses and reversals.
Net gains or losses on financial liabilities measured at amortised
cost include effects from early settlement and reversals of accrued
liabilities.
The disclosures required by IFRS 7 “Financial Instruments:
Disclosures”, paragraphs 31 – 42 (“Nature and Extent of Risks arising
from Financial Instruments”) can be found in
/
NOTE 07 and the Group
Management Report
/
SEE RISK AND OPPORTUNITY REPORT, P. 164.
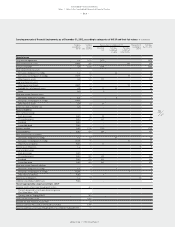
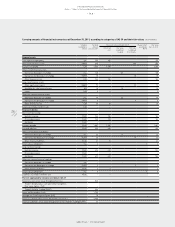
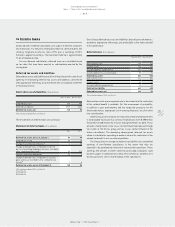
Fair value hierarchy of financial instruments according to IFRS 7 as at December 31, 2012 (€ in millions)
Fair value hierarchy, aggregated by category Fair value
Dec. 31, 2012
Level 1 Level 2 Level 3
Financial assets at fair value through profit or loss
Thereof: designated as such upon initial recognition (Fair Value Option - FVO) −
Thereof: Held for Trading (Financial Assets Held for Trading - FAHfT) 361 282 79 1)
Available-for-Sale Financial Assets (AfS) 22 22
Other financial assets
Derivatives being part of a hedge 44 44
Financial assets 427 348 79
Financial Liabilities at fair value through profit or loss Held for Trading (FLHfT) 11 11
Other financial liabilities
Derivatives being part of a hedge 49 49
Financial liabilities 60 60
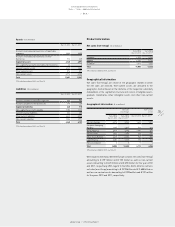
Fair value
Jan. 1, 2012
Gains Losses Fair value
Dec. 31, 2012
1) This category relates to a 9.1% investment in FC Bayern München AG of € 79 million. Dividends
are distributed by FC Bayern München AG instead of regular interest payments.
79 0 – 79
Level 1 is based on quoted prices in active markets for identical assets or liabilities.
Level 2 is based on inputs other than quoted prices included within Level 1 that are observable for the asset or liability, either directly (i.e. as prices) or indirectly (i.e. derived from prices).
Level 3 is based on inputs for the asset or liability that are not based on observable market data (unobservable inputs).