ICICI Bank 2016 Annual Report Download - page 99
Download and view the complete annual report
Please find page 99 of the 2016 ICICI Bank annual report below. You can navigate through the pages in the report by either clicking on the pages listed below, or by using the keyword search tool below to find specific information within the annual report.-
 1
1 -
2
-
3
-
4
-
5
-
6
-
7
-
8
-
9
-
10
-
11
-
12
-
13
-
14
-
15
-
16
-
17
-
18
-
19
-
20
-
21
-
22
-
23
-
24
-
25
-
26
-
27
-
28
-
29
-
30
-
31
-
32
-
33
-
34
-
35
-
36
-
37
-
38
-
39
-
40
-
41
-
42
-
43
-
44
-
45
-
46
-
47
-
48
-
49
-
50
-
51
-
52
-
53
-
54
-
55
-
56
-
57
-
58
-
59
-
60
-
61
-
62
-
63
-
64
-
65
-
66
-
67
-
68
-
69
-
70
-
71
-
72
-
73
-
74
-
75
-
76
-
77
-
78
-
79
-
80
-
81
-
82
-
83
-
84
-
85
-
86
-
87
-
88
-
 89
89 -
 90
90 -
 91
91 -
 92
92 -
 93
93 -
 94
94 -
 95
95 -
 96
96 -
 97
97 -
 98
98 -
 99
99 -
 100
100 -
 101
101 -
 102
102 -
 103
103 -
 104
104 -
 105
105 -
 106
106 -
 107
107 -
 108
108 -
 109
109 -
110
-
111
-
112
-
113
-
114
-
115
-
116
-
117
-
118
-
119
-
120
-
121
-
122
-
123
-
124
-
125
-
126
-
127
-
128
-
129
-
130
-
131
-
132
-
133
-
134
-
135
-
136
-
137
-
138
-
139
-
140
-
141
-
142
-
143
-
144
-
145
-
146
-
147
-
148
-
149
-
150
-
151
-
152
-
153
-
154
-
155
-
156
-
157
-
158
-
159
-
160
-
161
-
162
-
163
-
164
-
165
-
166
-
167
-
168
-
169
-
170
-
171
-
172
-
173
-
174
-
175
-
176
-
177
-
178
-
179
-
180
-
181
-
182
-
183
-
184
-
185
-
186
-
187
-
188
-
189
-
190
-
191
-
192
-
193
-
194
-
195
-
196
-
197
-
198
-
199
-
200
-
201
-
202
-
203
-
204
-
205
-
206
-
207
-
208
-
209
-
210
-
211
-
212
-
213
-
214
-
215
-
216
-
217
-
218
-
219
-
220
-
221
-
222
-
223
-
224
-
225
-
226
-
227
-
228
-
229
-
230
-
231
-
232
-
233
-
234
-
235
-
236
-
237
-
238
-
239
-
240
-
241
-
242
-
243
-
244
-
245
-
246
-
247
-
248
-
249
-
250
-
251
-
252
 |
 |

97Annual Report 2015-2016
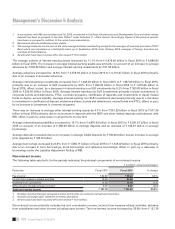
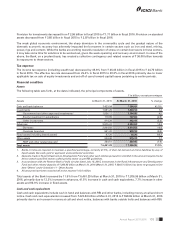
` in billion, except percentages
Particulars Fiscal 2015 Fiscal 2016 % change
Operating prot 197.20 238.63 21.0
Provisions, net of write-backs (excluding collective contingency
and related reserve (CCRR)) 39.00 80.67 –
Prot before CCRR and tax 158.20 157.96 (0.2)
Collective contingency and related reserve – 36.00 –
Prot before tax 158.20 121.96 (22.9)
Tax, including deferred tax 46.45 24.70 (46.8)
Prot after tax ` 111.75 ` 97.26 (13.0%)
1. Includes merchant foreign exchange income and margin on customer derivative transactions.
2. Includes exchange gains related to overseas operations.
3. All amounts have been rounded off to the nearest ` 10.0 million.
4. Prior period figures have been re-grouped/re-arranged, where necessary.
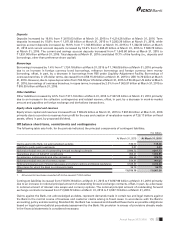
Key ratios
The following table sets forth, for the periods indicated, the key nancial ratios.
Particulars Fiscal 2015 Fiscal 2016
Return on average equity (%)1 14.32 11.32
Return on average assets (%)2 1.86 1.49
Earnings per share (`) 19.32 16.75
Book value per share (`) 138.74 154.32
Fee to income (%) 26.55 24.13
Cost to income (%)3 36.83 34.70
1. Return on average equity is the ratio of the net profit after tax to the quarterly average equity share capital and reserves.
2. Return on average assets is the ratio of net profit after tax to average assets.
3. Cost represents operating expense. Income represents net interest income and non-interest income.
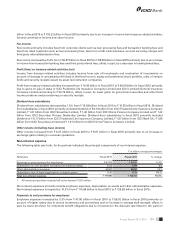
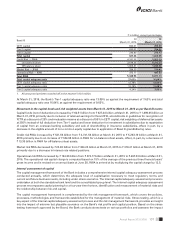
Net interest income and spread analysis
The following table sets forth, for the periods indicated, the net interest income and spread analysis.
` in billion, except percentages
Fiscal 2015 Fiscal 2016 % change
Interest income ` 490.92 ` 527.39 7.4%
Interest expense 300.52 315.15 4.9
Net interest income 190.40 212.24 11.5
Average interest-earning assets1 5,476.64 6,084.83 11.1
Average interest-bearing liabilities1` 4,870.63 ` 5,391.57 10.7
Net interest margin 3.48% 3.49% –
Average yield on interest-earning assets 8.96% 8.67% –
Average cost of funds 6.17% 5.85% –
Interest spread 2.79% 2.82% –
1. The average balances are the sum of the daily average balances outstanding except for the averages of overseas branches of ICICI
Bank which are calculated on a fortnightly basis up to September 2014. From October 2014, averages of foreign branches are
averages of daily balances.
2. All amounts have been rounded off to the nearest ` 10.0 million.